• Home
  • About

GIScience News Blog

News of Heidelberg University’s GIScience Research Group.

Feed on
Posts
Comments
« Heidelberg Mobil moves into Mathematikon Heidelberg
This Thursday 2nd MissingMaps Mapathon for Sokode/Togo in Heidelberg »

Clustering and Analyzing Air Pollution Data using Self-Organizing Maps

Jun 15th, 2016 by GIScienceHD

Today Enrico Steiger is presenting the following paper at AGILE 2016 conference Helsinki:

Lee, M., Steiger, E. Zipf, A. (2016): Clustering and Analyzing Air Pollution Data using Self-Organizing Maps. 19th AGILE Conference on Geographic Information Science. Helsinki, Finnland.

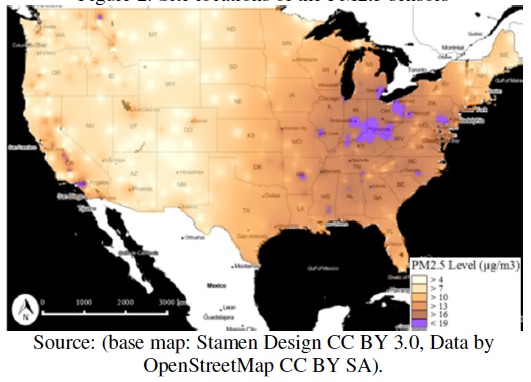
In Geographic Information Science the rise in the availability of spatial data paved ways for increased research in different spatial data mining techniques. This paper presents a Spatial Self-Organizing Map (Spatial SOM) for analysing high-dimensional and complex spatial datasets. The results of the selected case study with air pollution data for the US has demonstrated that Spatial SOMs are an effective and efficient analysis tool with the ability to explore, detect, and visualize latent spatial structures and characteristics within large datasets.
In this study, we set out the objective to contribute and provide insights in overcoming the challenges with spatial big data. Specifically, we aimed to study ways in which we can apply and assess spatial SOM algorithms for handling large datasets, and how we can uncover latent structures in big data with spatial dependence.
The detailed analysis of the Spatial SOM result demonstrates that Spatial SOM is an effective tool in detecting cluster with spatial dependence in the data. It is able to detect chemical species variation across continental United States. In conclusion, the case study validates the effectiveness of Spatial SOM as an analysis tool for discovering not only hidden relationships in general attribute features but also for spatial features as well.
We demonstrated that Spatial SOMs can detect underlying latent spatial and chemical structures and covariates from pollution data collected from sensors using a case study with air pollution data. In other SOM variants, usually spatial attributes are treated as any other attributes given equal weights. However, in a Spatial SOM, more weight is given to the spatial attribute, so that input vectors or observations are largely aggregated based on their geographical proximity first, and then fine tuned by other chemical features.

Tags: Big Data, data mining, SOM

Posted in Events, Publications

Comments are closed.

  • About

    GIScience News Blog
    News of Heidelberg University’s GIScience Research Group.
    There are 1,461 Posts and 0 Comments so far.

  • Meta

    • Log in
    • Entries RSS
    • Comments RSS
    • WordPress.org
  • Recent Posts

    • Find the route to your nearest Covid-19 vaccination center in Germany — new App by HeiGIT based on OpenStreetMap and openrouteservice
    • ohsome street network analysis part 1
    • Keynote at McGILL GIS DAY: Analysing and Improving OpenStreetMap for Humanitarian Aid with Data Mining and GeoAI
    • Update on “Accessibility of COVID-19 vaccination centers in Germany”
    • Globales Gletschermonitoring - Chance und Herausforderung — HGG Vortrag am 19.Januar 2021 Dr. Isabelle Gärtner-Roer, World Glacier Monitoring Service, Universität Zürich
  • Tags

    3D 3DGEO Big Spatial Data CAP4Access Citizen Science Colloquium crisis mapping Crowdsourcing data quality disaster DisasterMapping GeoNet.MRN GIScience heigit HOT humanitarian Humanitarian OpenStreetMap team intrinsic quality analysis landuse laser scanning Lidar Mapathon MapSwipe Missing Maps MissingMaps ohsome ohsome example Open data openrouteservice OpenStreetMap OSM OSM History Analytics OSMlanduse Quality quality analysis remote sensing routing social media spatial analysis Teaching terrestrial laser scanning Twitter VGI Wheelchair Navigation Workshop
  • Archives

    • January 2021
    • December 2020
    • November 2020
    • October 2020
    • September 2020
    • August 2020
    • July 2020
    • June 2020
    • May 2020
    • April 2020
    • March 2020
    • February 2020
    • January 2020
    • December 2019
    • November 2019
    • October 2019
    • September 2019
    • August 2019
    • July 2019
    • June 2019
    • May 2019
    • April 2019
    • March 2019
    • February 2019
    • January 2019
    • December 2018
    • November 2018
    • October 2018
    • September 2018
    • August 2018
    • July 2018
    • June 2018
    • May 2018
    • April 2018
    • March 2018
    • February 2018
    • January 2018
    • December 2017
    • November 2017
    • October 2017
    • September 2017
    • August 2017
    • July 2017
    • June 2017
    • May 2017
    • April 2017
    • March 2017
    • February 2017
    • January 2017
    • December 2016
    • November 2016
    • October 2016
    • September 2016
    • August 2016
    • July 2016
    • June 2016
    • May 2016
    • April 2016
    • March 2016
    • February 2016
    • January 2016
    • December 2015
    • November 2015
    • October 2015
    • September 2015
    • August 2015
    • July 2015
    • June 2015
    • May 2015
    • April 2015
    • March 2015
    • February 2015
    • January 2015
    • December 2014
    • November 2014
    • October 2014
    • September 2014
    • August 2014
    • July 2014
    • June 2014
    • May 2014
    • April 2014
    • March 2014
    • February 2014
    • January 2014
    • December 2013
    • November 2013
    • October 2013
    • September 2013
    • August 2013
    • July 2013
    • June 2013
    • May 2013
    • April 2013
  •  

    June 2016
    M T W T F S S
    « May   Jul »
     12345
    6789101112
    13141516171819
    20212223242526
    27282930  
  • Recent Comments

    GIScience News Blog CC by-nc-sa Some Rights Reserved.

    Free WordPress Themes | Fresh WordPress Themes