• Home
  • About

GIScience News Blog

News of Heidelberg University’s GIScience Research Group.

Feed on
Posts
Comments
« HeiGIT/GIScience at Global Platform for Disaster Risk Reduction and Multi Hazard Early Warning Conference
Letzte Vorbereitungen: Start der MS Wissenschaft am 16. Mai 2019 »

How to become ohsome part 5: Measuring numbers of users editing different OSM features

May 6th, 2019 by Fabian Kowatsch

Besides dealing with a snake, making quality assessments, or generating comparable statistics, one needs to know how to handle the whole functionality provided by the ohsome API to really become ohsome. And to achieve exactly that, this blog presents the last missing entry point to the API from the current toolkit, namely the /users resource. With its help you can receive aggregated statistics on the OpenStreetMap contributors (also called users), who were editing any element, in any place, at any time that is available in our global OpenStreetMap History Database (OSHDB). In this episode we will take a look at numbers of users who were editing different features, e.g. streets, buildings and compare them through looking at different regions. Which OSM-key might be edited by more users: highway, or building? And is it the same for both of our investigated regions (Nepal and Ghana)?

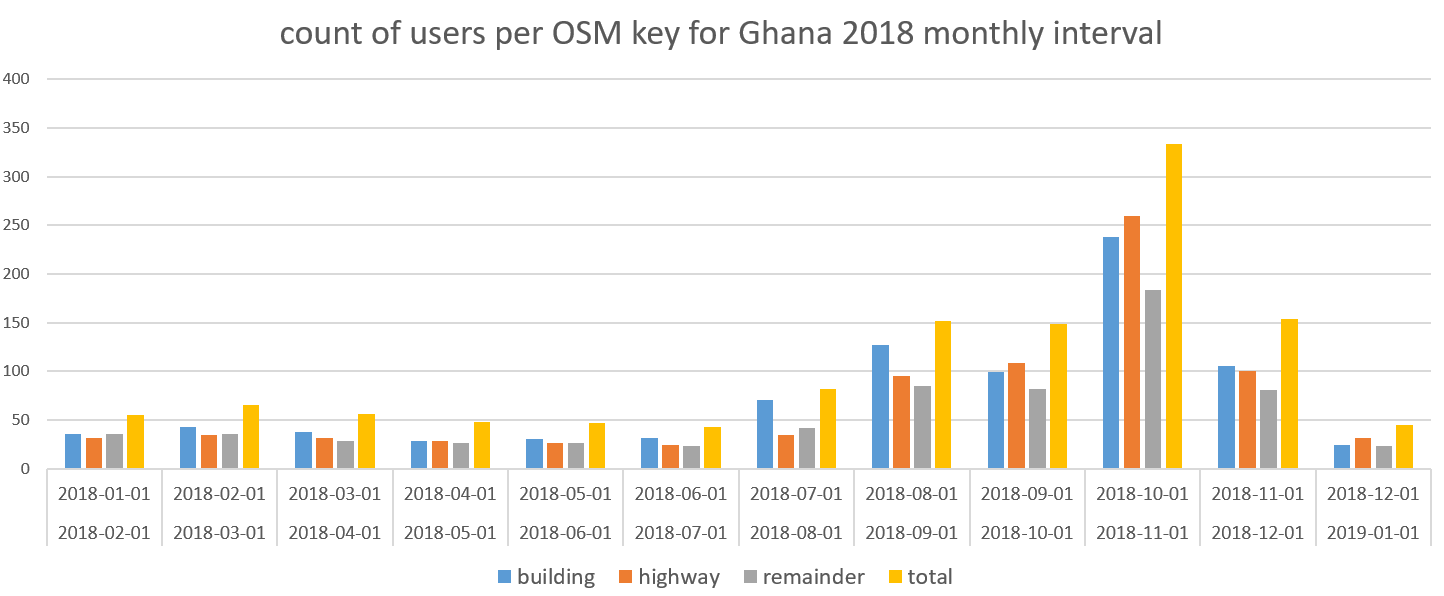
Similar to the /elementsFullHistory resource, which we used in part 1 of this blog series, the /users resource also uses the contribution view of the OSHDB. That means that we do not look at the data at specific points in time, but over the course of one (or more) time period(s). This way we can get all the changes of the OSM data and thus be able to analyze all the contributions from the users, which we can further specify via our filters. So let’s take a look at the first result that we have created from a csv response of the ohsome API. It shows the number of contributors editing features with the OSM type way as total, as well as the keys building, highway and other features (remainder) in the year 2018 for a monthly interval for Ghana. For clarification: If a user edited a highway and a building, he/she is counted in both groups. The same applies to the remainder, which includes edits on features having all tags but highway and building, as well as to the different time intervals, where an active user is counted for each time interval. The total value tells us the number of distinct active users for our defined filters. We can see that until the middle of the year, building and highway are both edited by roughly 25 to 45 users as well as the remainder. Then the building key has a higher increase in users until September, where the highest numbers switch in favor of the highway key. Then the highest numbers continue to switch between both keys until the end of 2018.

The second diagram shows the count of users for Nepal, again for the year 2018 and divided into monthly intervals. In contrary to the first diagram, the building key has the higher numbers of users throughout the whole year and also the remainder group has more distinct users for most months.

As usual, we’ve created a snippet for these requests that show you the request URLs, the used data and parameters, as well as the returned responses. In the snippet you will find the same comparison of these two regions also for a time period of 10 years and a yearly interval. The GeoJSON files are retrieved through OSM Admin Boundaries Map 4.4.6. As always, you can reach us via info@heigit.org. Stay ohsome!

Tags: become-ohsome, Big Spatial Data, heigit, intrinsic quality analysis, ohsome, ohsome example, oshdb, OSM, OSM History Analytics

Posted in OSM, Services, Software

Comments are closed.

  • About

    GIScience News Blog
    News of Heidelberg University’s GIScience Research Group.
    There are 1,679 Posts and 0 Comments so far.

  • Meta

    • Log in
    • Entries RSS
    • Comments RSS
    • WordPress.org
  • Recent Posts

    • High Resolution Data Insights from OpenStreetMap Element Vectorisation
    • Data publication: Point clouds of snow-on and snow-off forest site
    • Job Offer: Deep Learning Engineer (m/f/d, up to 100%)
    • GIScience Postdoc/Senior Researcher Opportunity for OpenStreetMap Road Quality Analysis
    • Assessing road criticality and loss of healthcare accessibility during floods: the case of Cyclone Idai, Mozambique 2019
  • Tags

    3D 3DGEO Big Spatial Data CAP4Access Citizen Science Conference crisis mapping Crowdsourcing data quality deep learning disaster DisasterMapping GeoNet.MRN GIScience heigit HOT humanitarian humanitarian mapping Humanitarian OpenStreetMap team intrinsic quality analysis landuse laser scanning Lidar machine-learning Mapathon MapSwipe MissingMaps Missing Maps ohsome ohsome example Open data openrouteservice OpenStreetMap OSM OSM History Analytics Public Health Quality quality analysis remote sensing routing social media spatial analysis Teaching VGI Workshop
  • Archives

    • February 2023
    • January 2023
    • December 2022
    • November 2022
    • October 2022
    • September 2022
    • August 2022
    • July 2022
    • June 2022
    • May 2022
    • April 2022
    • March 2022
    • February 2022
    • January 2022
    • December 2021
    • November 2021
    • October 2021
    • September 2021
    • August 2021
    • July 2021
    • June 2021
    • May 2021
    • April 2021
    • March 2021
    • February 2021
    • January 2021
    • December 2020
    • November 2020
    • October 2020
    • September 2020
    • August 2020
    • July 2020
    • June 2020
    • May 2020
    • April 2020
    • March 2020
    • February 2020
    • January 2020
    • December 2019
    • November 2019
    • October 2019
    • September 2019
    • August 2019
    • July 2019
    • June 2019
    • May 2019
    • April 2019
    • March 2019
    • February 2019
    • January 2019
    • December 2018
    • November 2018
    • October 2018
    • September 2018
    • August 2018
    • July 2018
    • June 2018
    • May 2018
    • April 2018
    • March 2018
    • February 2018
    • January 2018
    • December 2017
    • November 2017
    • October 2017
    • September 2017
    • August 2017
    • July 2017
    • June 2017
    • May 2017
    • April 2017
    • March 2017
    • February 2017
    • January 2017
    • December 2016
    • November 2016
    • October 2016
    • September 2016
    • August 2016
    • July 2016
    • June 2016
    • May 2016
    • April 2016
    • March 2016
    • February 2016
    • January 2016
    • December 2015
    • November 2015
    • October 2015
    • September 2015
    • August 2015
    • July 2015
    • June 2015
    • May 2015
    • April 2015
    • March 2015
    • February 2015
    • January 2015
    • December 2014
    • November 2014
    • October 2014
    • September 2014
    • August 2014
    • July 2014
    • June 2014
    • May 2014
    • April 2014
    • March 2014
    • February 2014
    • January 2014
    • December 2013
    • November 2013
    • October 2013
    • September 2013
    • August 2013
    • July 2013
    • June 2013
    • May 2013
    • April 2013
  •  

    May 2019
    M T W T F S S
    « Apr   Jun »
     12345
    6789101112
    13141516171819
    20212223242526
    2728293031  
  • Recent Comments

    GIScience News Blog CC by-nc-sa Some Rights Reserved.

    Free WordPress Themes | Fresh WordPress Themes