
Vector-born diseases – such as Malaria, Dengue or Zika are serious health hazards in tropical regions. The outbreaks show high temporal and spatial variability. For example, the number of dengue cases in the state of São Paulo increased by 2,124% in the first 11 weeks of 2019 (up to March 16, 229,064 cases were reported), according to a survey by the Ministry of Health. It is important to monitor, model and predict such dynamics to be able to provide essential information for health administration units and NGOs.
Since most mosquitos have a short-distance flight range and a small dispersal rate, transmission of virus or parasites relies on the host’s movements. That means there should be strong connections between human’s movements and disease’s transmission. Therefore, it is necessary to capture human mobility pattern.
One way to extract human mobility pattern is to use geolocated Tweets. Compared with traditional commuting questionnaire-based surveys and phone call data, Twitter data is more convenient to work with. It has a relatively high spatial resolution and available both in near-real time as well as for past time periods. These mobility data will be later on combined with health report data to reveal the potential transmission patterns.
Tweets were collected from the Twitter free API, through which, we only can get 1% of total volume. Since Oct. 2018 to May 2019, in total 434,170 tweets from São Paulo city (Brazil) were collected, and visualized in figure 1a.
In order to align with our future processing, we choose the street block level as our minimal spatial unit. Street blocks were divided by the road network extracted from OSM (figure 1b).
Tweets were aggregated to street blocks and the number of movements of users estimated by sequential Tweets was calculated for all connected street blocks. This illustrates the strength of mobility connection between different street blocks (figure 1c and details in figure 1d). Large volumes of humans moving through an area intuitively increases the probability of contacting between an infected person and mosquitos present in the region. Using movements together with habitat quality from the perspective of mosquito, may help to estimate disease risk more precisely and to model potential outbreaks based on the strength of the connection between different street blocks (transmission chains).
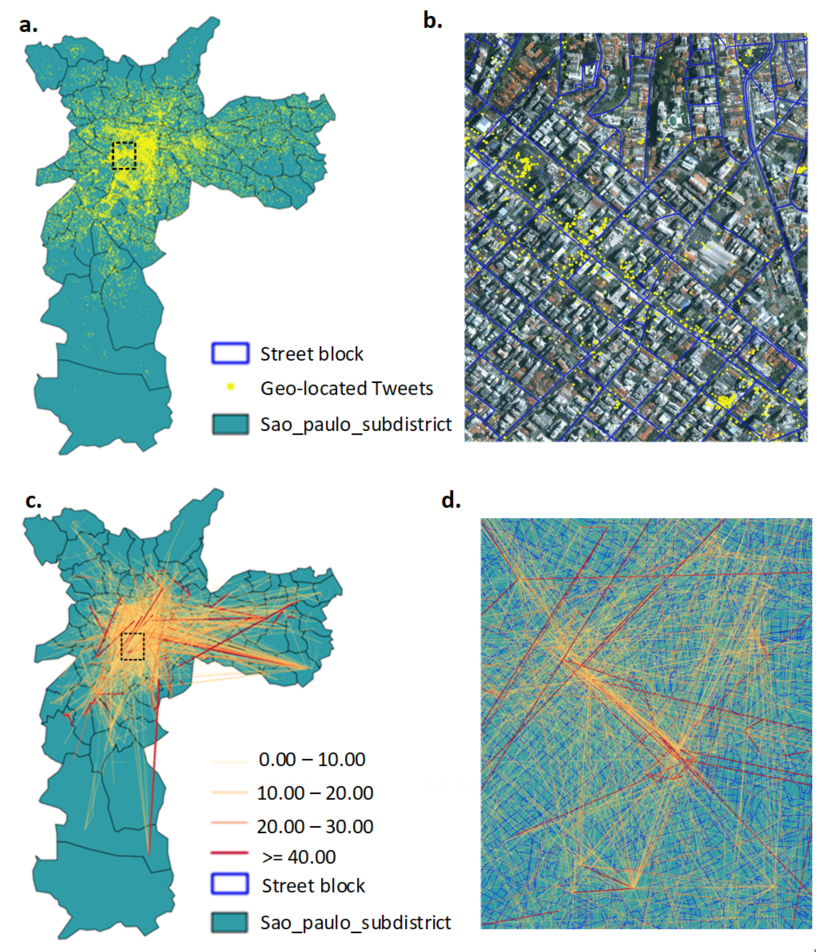
Figure 1a: Visualized geo-located Tweets as yellow dots and sub-districts of São Paulo as background. Figure 1b: Enlarged graph from the center of São Paulo with satellite image as background and blue lines show street blocks derived from OSM, yellow dots are Tweets; Figure 1c: The strength of connection between street blocks based on sequential Tweet locations. Figure 1d: enlarged graph from the black rectangle in figure 1c, which shows the detailed connections between street blocks.