
A new month – a new post of the how to become #ohsome blog series. Welcome to part 7, in which we will show you 7 different ways how you can send a request to the ohsome API using different tools and programming languages. In case this is your first blog of how to become ohsome (and awesome), check out the collection of all posts of this series.
As you probably know, the ohsome API allows non-programmers to analyze the rich data source of the OpenStreetMap (OSM) history. There are a lot of ways to perform analysis using the ohsome API. For the purpose of this article, let’s assume we want to calculate the perimeter of residential buildings in a small area of Heidelberg.
cURL
The first two ways of accessing the ohsome API are via using GET and POST requests through cURL. It is a widely known command line tool for getting and sending data through URL addresses. Open the command line interpreter of your operating system and digit the following command:
curl -X GET"https://api.ohsome.org/v1/elements/perimeter?bboxes=8.681609,49.414517,8.690232,49.417254&filter=building=residential&format=json&showMetadata=true&time=2014-01-01/2017-01-01/P1Y&timeout=30"-H"accept: application/json"
For a POST request, just use the following command:
curl -d @query -X POST https://api.ohsome.org/v1/elements/perimeter
query is a text file, which contains the query string:
bboxes=8.681609,49.414517,8.690232,49.417254&filter=building=residential&format=json&showMetadata=true&time=2014-01-01/2017-01-01/P1Y&timeout=30
Another blog post, where we’ve used cURL to perform our analysis can be found here.
Python
For the programmers among you, we have two more GET and POST examples using python. The GET request will look here as follows:
importrequestsURL='https://api.ohsome.org/v1/elements/perimeter'params={"bboxes":"8.681609,49.414517,8.690232,49.417254","filter":"building=residential","format":"json","showMetadata":"true","time":"2014-01-01/2017-01-01/P1Y","timeout":"30"}response=requests.get(URL, params=params)(response.json())
And analogous a POST request:
importrequestsURL='https://api.ohsome.org/v1/elements/perimeter'data={"bboxes":"8.681609,49.414517,8.690232,49.417254","filter":"building=residential","format":"json","showMetadata":"true","time":"2014-01-01/2017-01-01/P1Y","timeout":"30"}response=requests.post(URL, data=data)(response.json())
You like Python? Then you should definitely check out this post, where we’ve used a Jupyter Notebook to query the API and directly visualize the returned results.
R
Powerful statistical analysis and graphics: those are two aspects that one could associate with R. A GET request to the ohsome API in this programming language would look as follows:
library(httr)r <- GET("https://api.ohsome.org/v1/elements/perimeter?bboxes=8.681609,49.414517,8.690232,49.417254&filter=building=residential&format=json&showMetadata=true&time=2014-01-01/2017-01-01/P1Y&timeout=30")r
The code for a POST request:
library(httr)r <- POST("https://api.ohsome.org/v1/elements/perimeter", encode ="form", body = list(bboxes ="8.681609,49.414517,8.690232,49.417254", filter ="building=residential", format ="json", showMetadata ="true",time="2014-01-01/2017-01-01/P1Y", timeout ="30"))r
Swagger
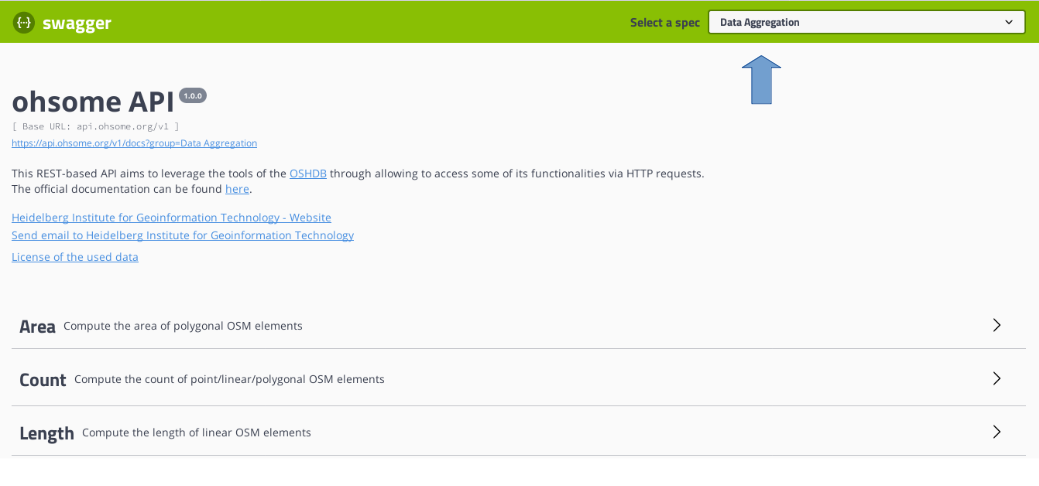
The 7th and last way that we want to explain you here how to access the ohsome API is through our swagger UI. It’s very suitable if you want to get an overview of all the available endpoints, or just make a query in a simple way.
First of all, select a spec that defines whether you want a data aggregation, a data extraction or just the metadata. In our case we stick with the pre-selected Data Aggregation spec.
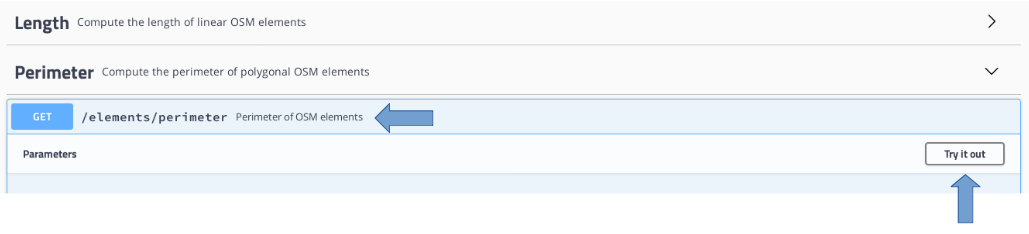
Next, you choose which kind of resource you want. Since we want to make a GET request for the resource /elements/perimeter, we select Perimeter, then GET /elements/perimeter After that, just click on Try it out.
Insert the values in the text area of the parameters that you want to use and click on “Execute”. You should get the requested data inside the response body window. Further, you can download the response through the download button on the bottom right.
Now you’ve seen seven different ways of how to speak to the ohsome API: GET and POST using cURL, python and R, as well as through the Swagger UI. This post only showed you one endpoint of many. Please head to our fresh documentation page (which got introduced here by the way) if you’re interested in knowing more about what the ohsome API has to offer. You have some further questions – contact us via info(at)heigit.org.
Background info: the aim of the ohsome OpenStreetMap History Data Analytics Platform is to make OpenStreetMap’s full-history data more easily accessible for various kinds of OSM data analytics tasks, such as data quality analysis, on a global scale. The ohsome API is one of its components, providing free and easy access to some of the functionalities of the ohsome platform via HTTP requests. Some intro can be found here:
-
ohsome general idea
-
ohsome general architecture
-
integration of simple feature keywords in the filters of the ohsome API.
-
how spatial joins queries work in the OpenStreetMap History Database OSHDB