
India accounts for nearly 18% of the worlds population. The country is also one of the main carrier of the worlds disease burden. Despite the general increase in life expectancy and decreasing mortality due to communicable diseases and malnutrition in recent years, the numbers of non-communicable diseases are rising substantially. Cardiovascular diseases such as diabetes and ischemic attacks are on the rise (Dandona 2017). Throughout the country the socioeconomic and health diversity is high and the Indian health system from under substantial shortcomings relating to infrastructure, the quality, and availability of services (Angell et al. 2019; Bhargava and Paul 2018).
Access to health services is determined by various factors, such as affordability, availability, information, accessibility, and compatibility. Affordability and information are cited as the main barriers that determine access (Butsch, 2011). Therefore, it is important that data on the spatial location of healthcare facilities is made freely available to all citizens. OpenStreetMap as a central global place for free geodata can be a solution to this. Public health officials can employ the data on care infrastructure to support their decision making. Businesses can use it to built new services on top. Citizens can easily interact with the data, getting answers on questions where and how to access a care service provider in their local community.
RMSI – a GIS consulting company, contributing since 2018 to OSM – leads efforts on an import of data on healthcare facilities in India since April 2019. The data source of the import are three different archives published by the Indian government on their open data portal: https://data.gov.in/. The archives include facilities like: hospitals, clinics, health centers and blood banks.
In the following we explore in which state when health-related objects were imported. We use HeiGIT technology to assess the imports to OSM: the ohsome API and the ohsome dashboard.
Tagging scheme for healthcare facilities in OSM:
- amenity=doctors :: min. 1 doctor present, non-inpatient care
- amenity=clinic :: min. 10 doctors present, non-inpatient care
- amenity=hospital :: inpatient care
- healthcare=* :: tag to cover more details on healthcare facilities (e.g. midwives, nurses, hospices, centres, blood banks, birthing centres)
Note that the tag “healthcare=*” is often used complementary to the other tags and therefore we do not evaluate that tag separately.
ohsome Results
Before the import started, only 5399 hospitals and 1557 other facilities were represented by OSM in India. Beginning in spring 2019 we have found a surge in new facilities added, across all states.
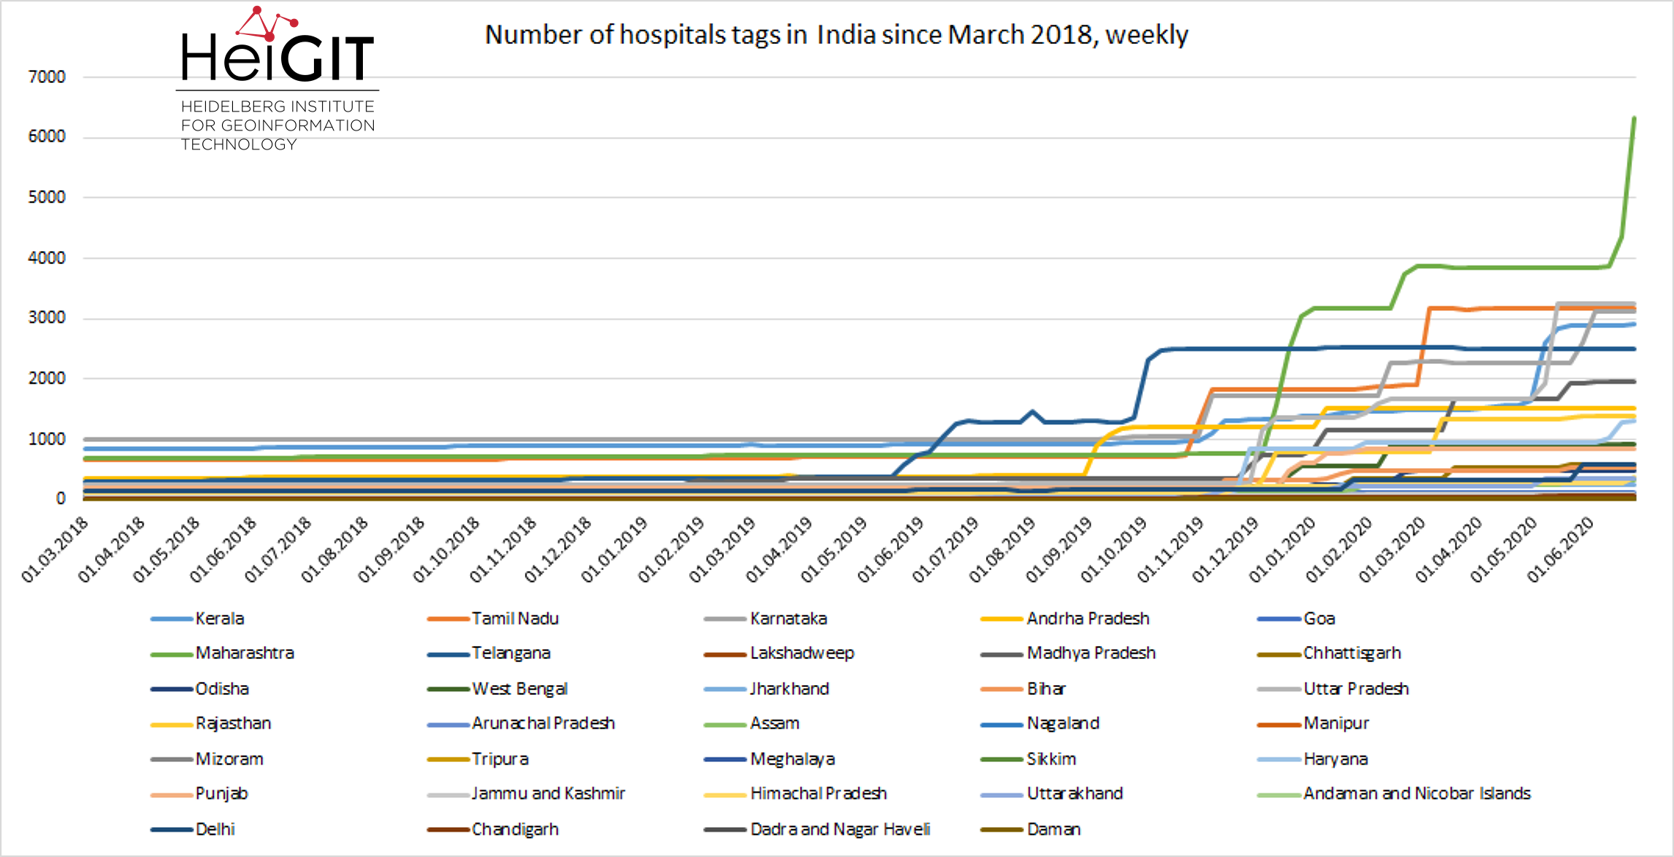
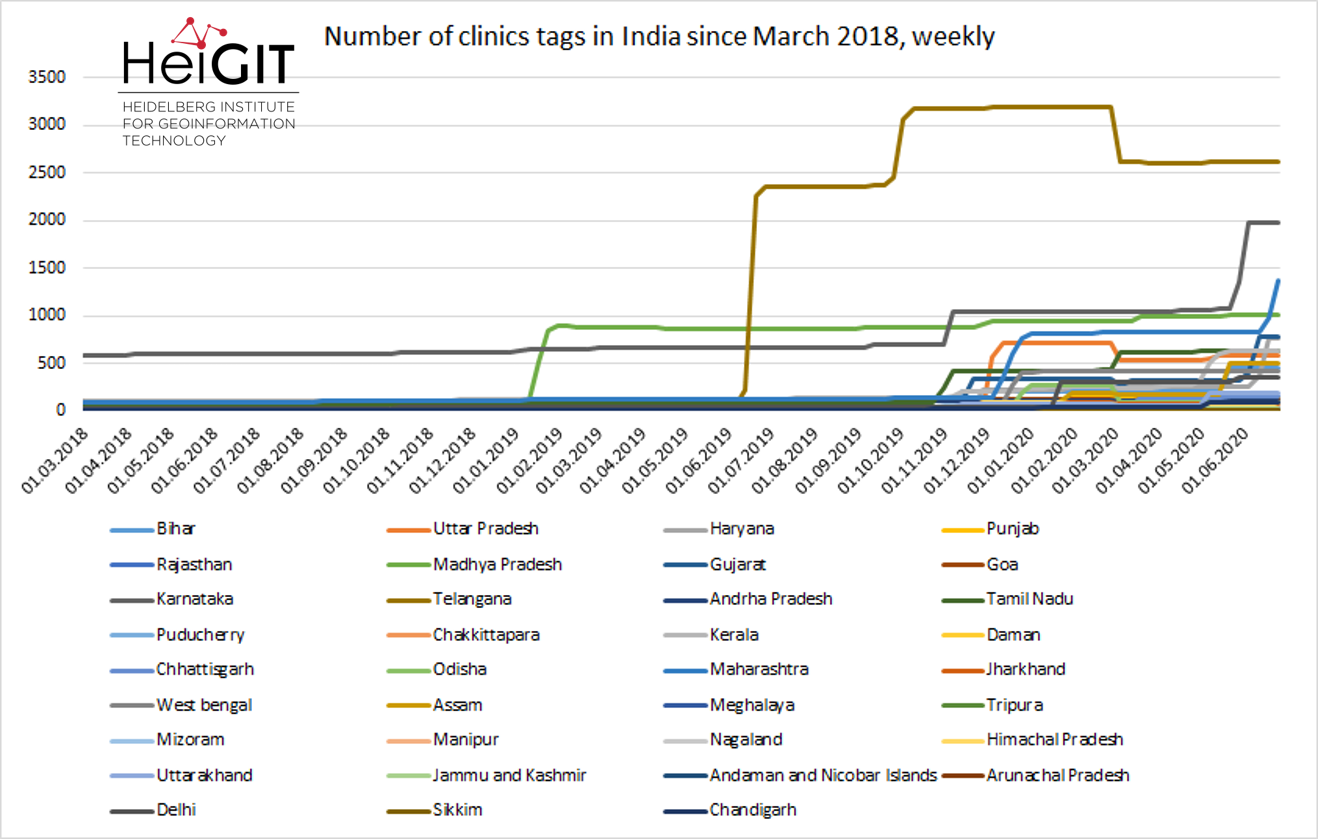
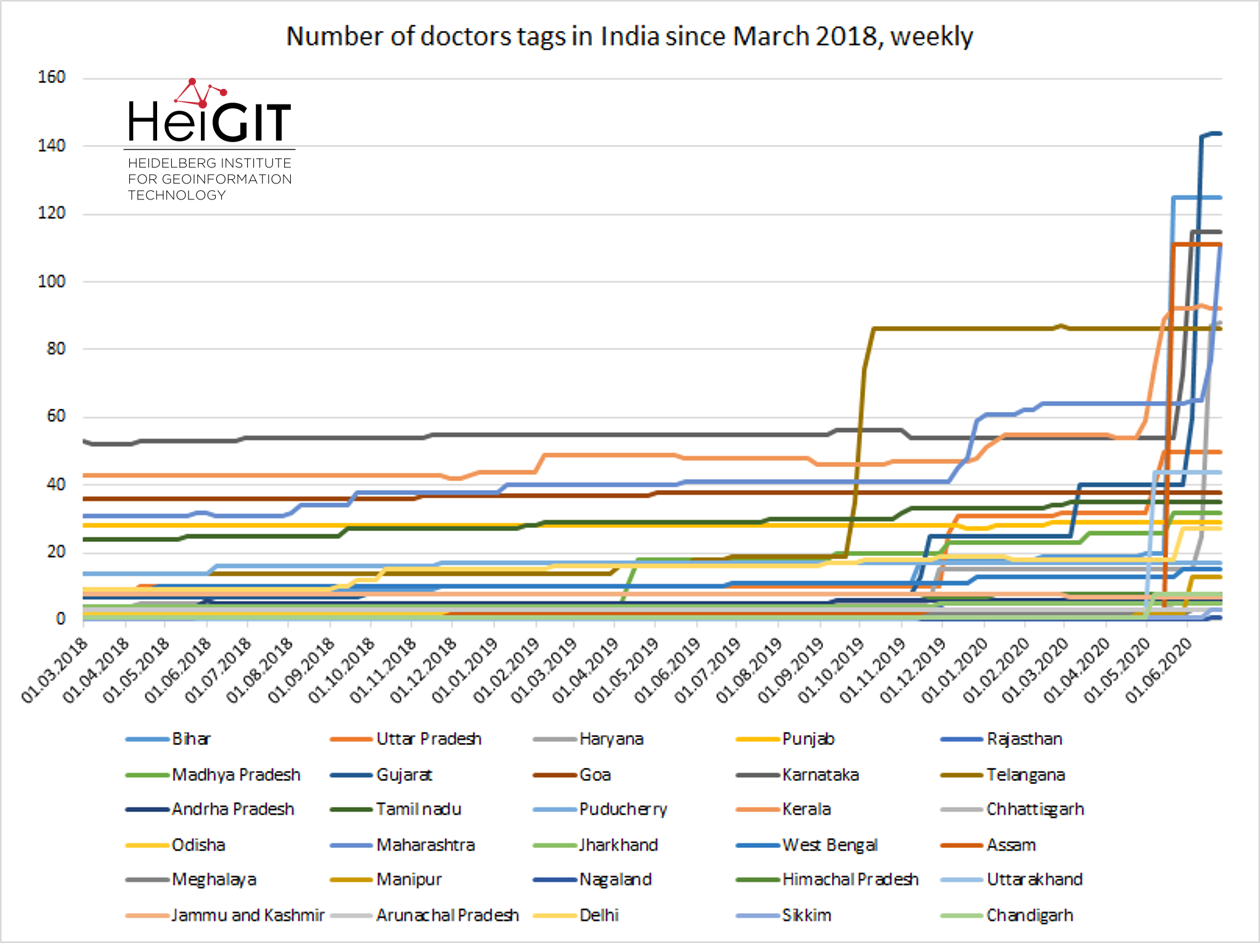
First significant imports started at the beginning of 2019 with the clinics tag, followed by the imports of hospitals in May 2019 and in (April) September 2019 with the doctors tag. For most Indian states the number of healthcare related objects has (min.) doubled and was carried out step by step. For example, at the beginning of our time series (March 2018), most doctors were tagged in Karnataka (SW-India) (53), this number changed by the end of May 2020 and rose from 53 to 73, and to 115 by the end of June 2020, where our time series ends. For other states – like Assam (NE-India) – only one doctor was tagged at the beginning of March 2018. Then the import started, and within one week there were about 100 new facilities.
The imports for hospitals draw a similar picture, but this tag shows the most imports, e.g. in Maharashtra (SW-India) the number of tagged hospitals rose from 682 to 6343 and they are still ongoing – what we can assume from the curve. For other states, like Andhra Pradesh (SE-India), the import stagnates since January. Another significant import of clinics happened in Telangana (southern India), where within one week the number of tags rose from 49 to 2252 in June 2019. Further imports for this state happened later in October/November 2019, but some tags were deleted in April 2020. In general, most significant imports happened in November 2019 and in some states they are ongoing.
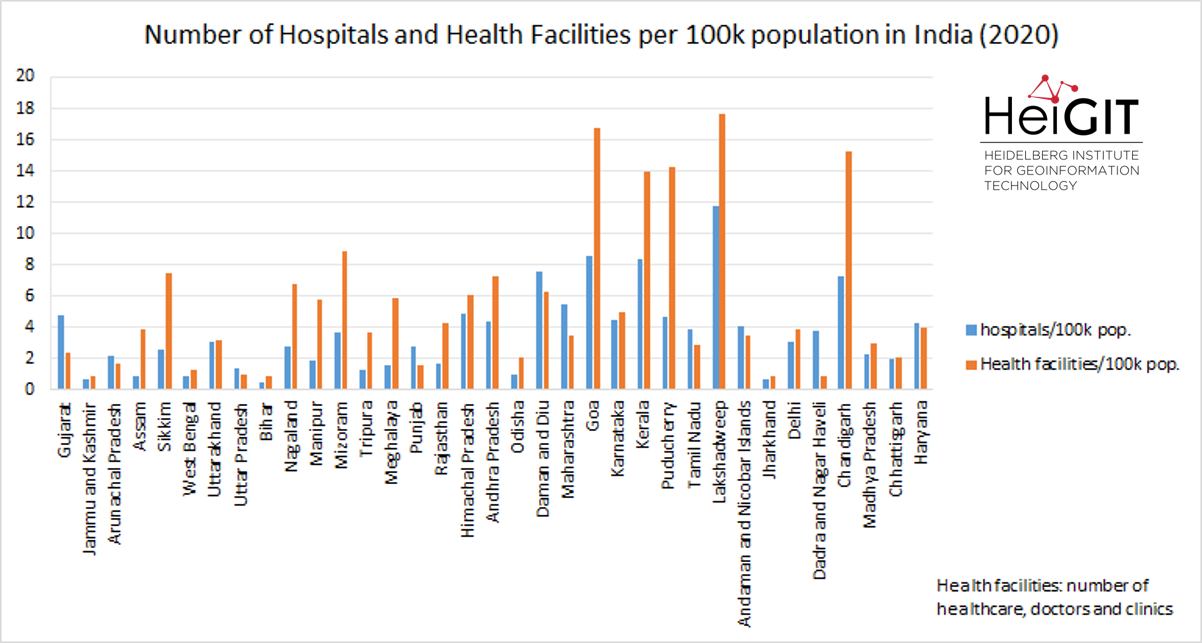
Looking at the density of tagged healthcare facilities per state, the highest density per 100k inhabitants is given in Lakshadweep (tropical archipelago), followed by Goa (SW-India) and Puducherry (SE-India). On the other hand the lowest density per 100k inhabitants is given in Bihar (NE-India), Jammu and Kashmir (northern India) and Jharkhand (NE-India):
Conclusion/Future
We have found that over the course of less than a year healthcare objects in India went from 6956 to 48101, including ~33000 hospitals. This is a huge increase in critically important geo data. Further, this data is now also easy accessible through the OSM ecosystem of diverse services. Based on this data, we were able to determine in more detail which Indian states have a high density of health care infrastructure and which have a low density of health care facilities. However, this is still a rather macro perspective. With the new data now in OSM, everyone can assess the distribution on a spatial scale that suits their use case best.
In an upcoming analysis we will focus on the attributes. What thematic information we can derive from health facilities in India. How dense are these facilities tagged. What is actually tagged, and furthermore for what facilities and where in India can we derive capacity information.
Related Work
- Ohsome literature:
Raifer, M., Troilo, R., Kowatsch, F., Auer, M., Loos, L., Marx, S., Przybill, K., Fendrich, S., Mocnik, F.-B.& Zipf, A. (2019): OSHDB: a framework for spatio-temporal analysis of OpenStreetMap history data.Open Geospatial Data, Software and Standards 2019 4:3. https://doi.org/10.1186/s40965-019-0061-3 - Ohsome tutorial series: How to become ohsome
- Ohsome and healthcare: OSM history – the example of health related amenities
- Non-technical ohsome interface: Ohsome Dashboard
- Healthcare accessibility:
- healthcare access analysis in Sub-Saharan Africa
- Geldsetzer, P.; Reinmuth, M.; O Ouma, P.; Lautenbach, S.; A Okiro, E.; Bärnighausen, T.; Zipf, A. (2020): Mapping physical access to health care for older adults in sub-Saharan Africa and implications for the COVID-19 response: a cross-sectional analysis https://doi.org/10.1016/S2666-7568(20)30010-6