
OpenStreetMap (OSM) offers many possibilities and holds potential in the area of freely available infrastructure data for the health sector. Nevertheless, it is important to underline that the quality of the information is different in each country, since the mapping activity is strongly affected by the size of the community of volunteers.
Monetary barriers prevent the emergence of mapping communities in many parts of the world. Micro-grants are one way to accelerate the mapping activity. Their purpose is to cover costs for internet access, devices, training, and field activities in communities. Regarding OSM micro-grants have been provided so far by either the Humanitarian OpenStreetMap Team (HOT) or the OpenStreetMap Foundation (OSMF). This support helps to overcome some existing barriers that prevent mapping and crucial local knowledge finds its way on the map.
During the year 2020, OpenStreetMap Senegal received a “Rapid Response Microgrant”. In cooperation with healthsites.io, OpenStreetMap Senegal projected to map 197 hospitals in Senegal and updated information on availability of emergency health services at facilities. Projects like this improve the completeness and usability of OSM for the health sector.
In the following we show how the data evolved over the course of 2020 and the project’s timeline. Furthermore, the impact of newly available information on emergency services and capacity is assessed with the Openrouteservice. (We informed in an earlier post about the cooperation between healthsites.io and the HeiGIT.)
Mapping Activity
We fetched the updated 2020 data with the ohsome API. Then, an already established workflow was used to generate maps that show the accessibility before and after the mapping campaign.
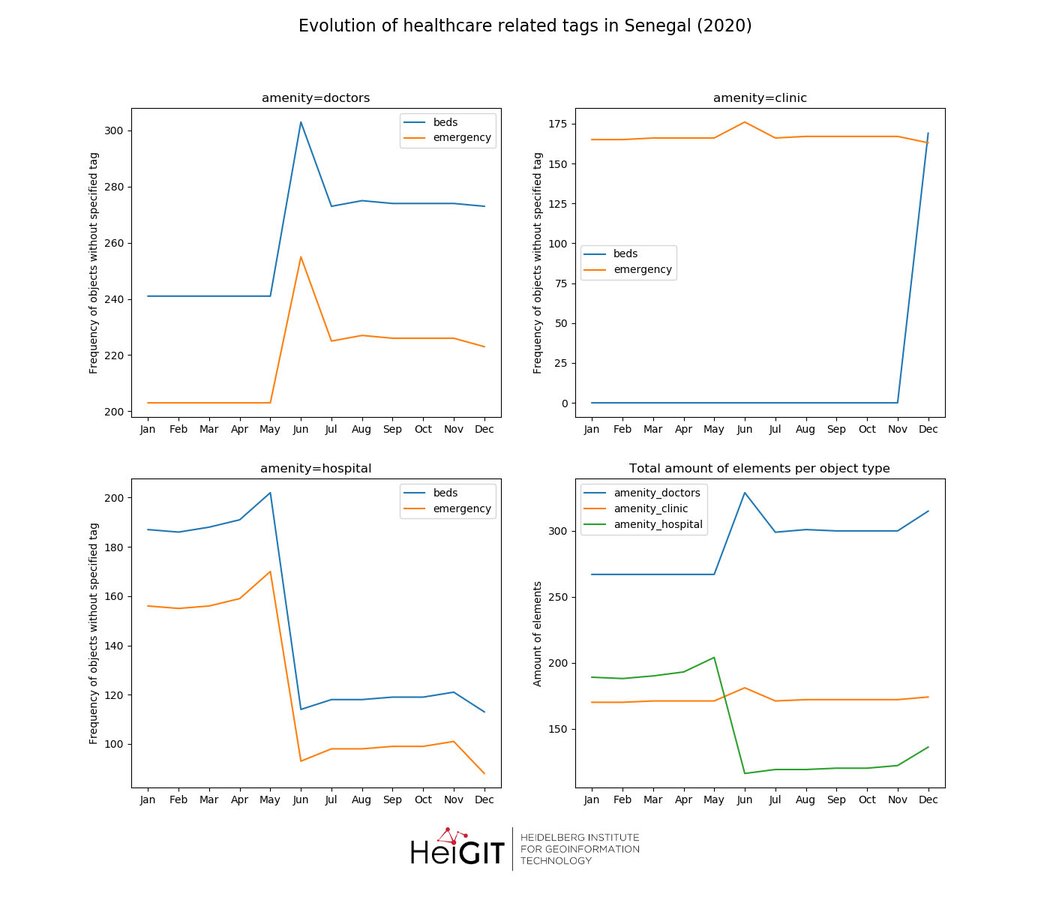
Available information on emergency capacity and bed capacity is grouped into healthcare object types: doctors, clinics, hospitals. The frequency of the tags of interest beds and emergency is shown over time in Figure 1.
The three object types were chosen because they are the standard healthcare object types. Apparent changes happened to OSM between May and July. The amount of hospital objects (bottom-left graph) without one of the two specified values have decreased significantly in this period. A sudden increase occurred for clinic objects (top-left), that were added without a beds tag. Further, the amount of objects with the attribute amenity=hospital diminished considerably while the number of elements increased in amenity=doctors. It is possible, that tags were shifted amongst these objects from amenity=hospital to amenity=doctors.
Accessibility of Health Care Facilities
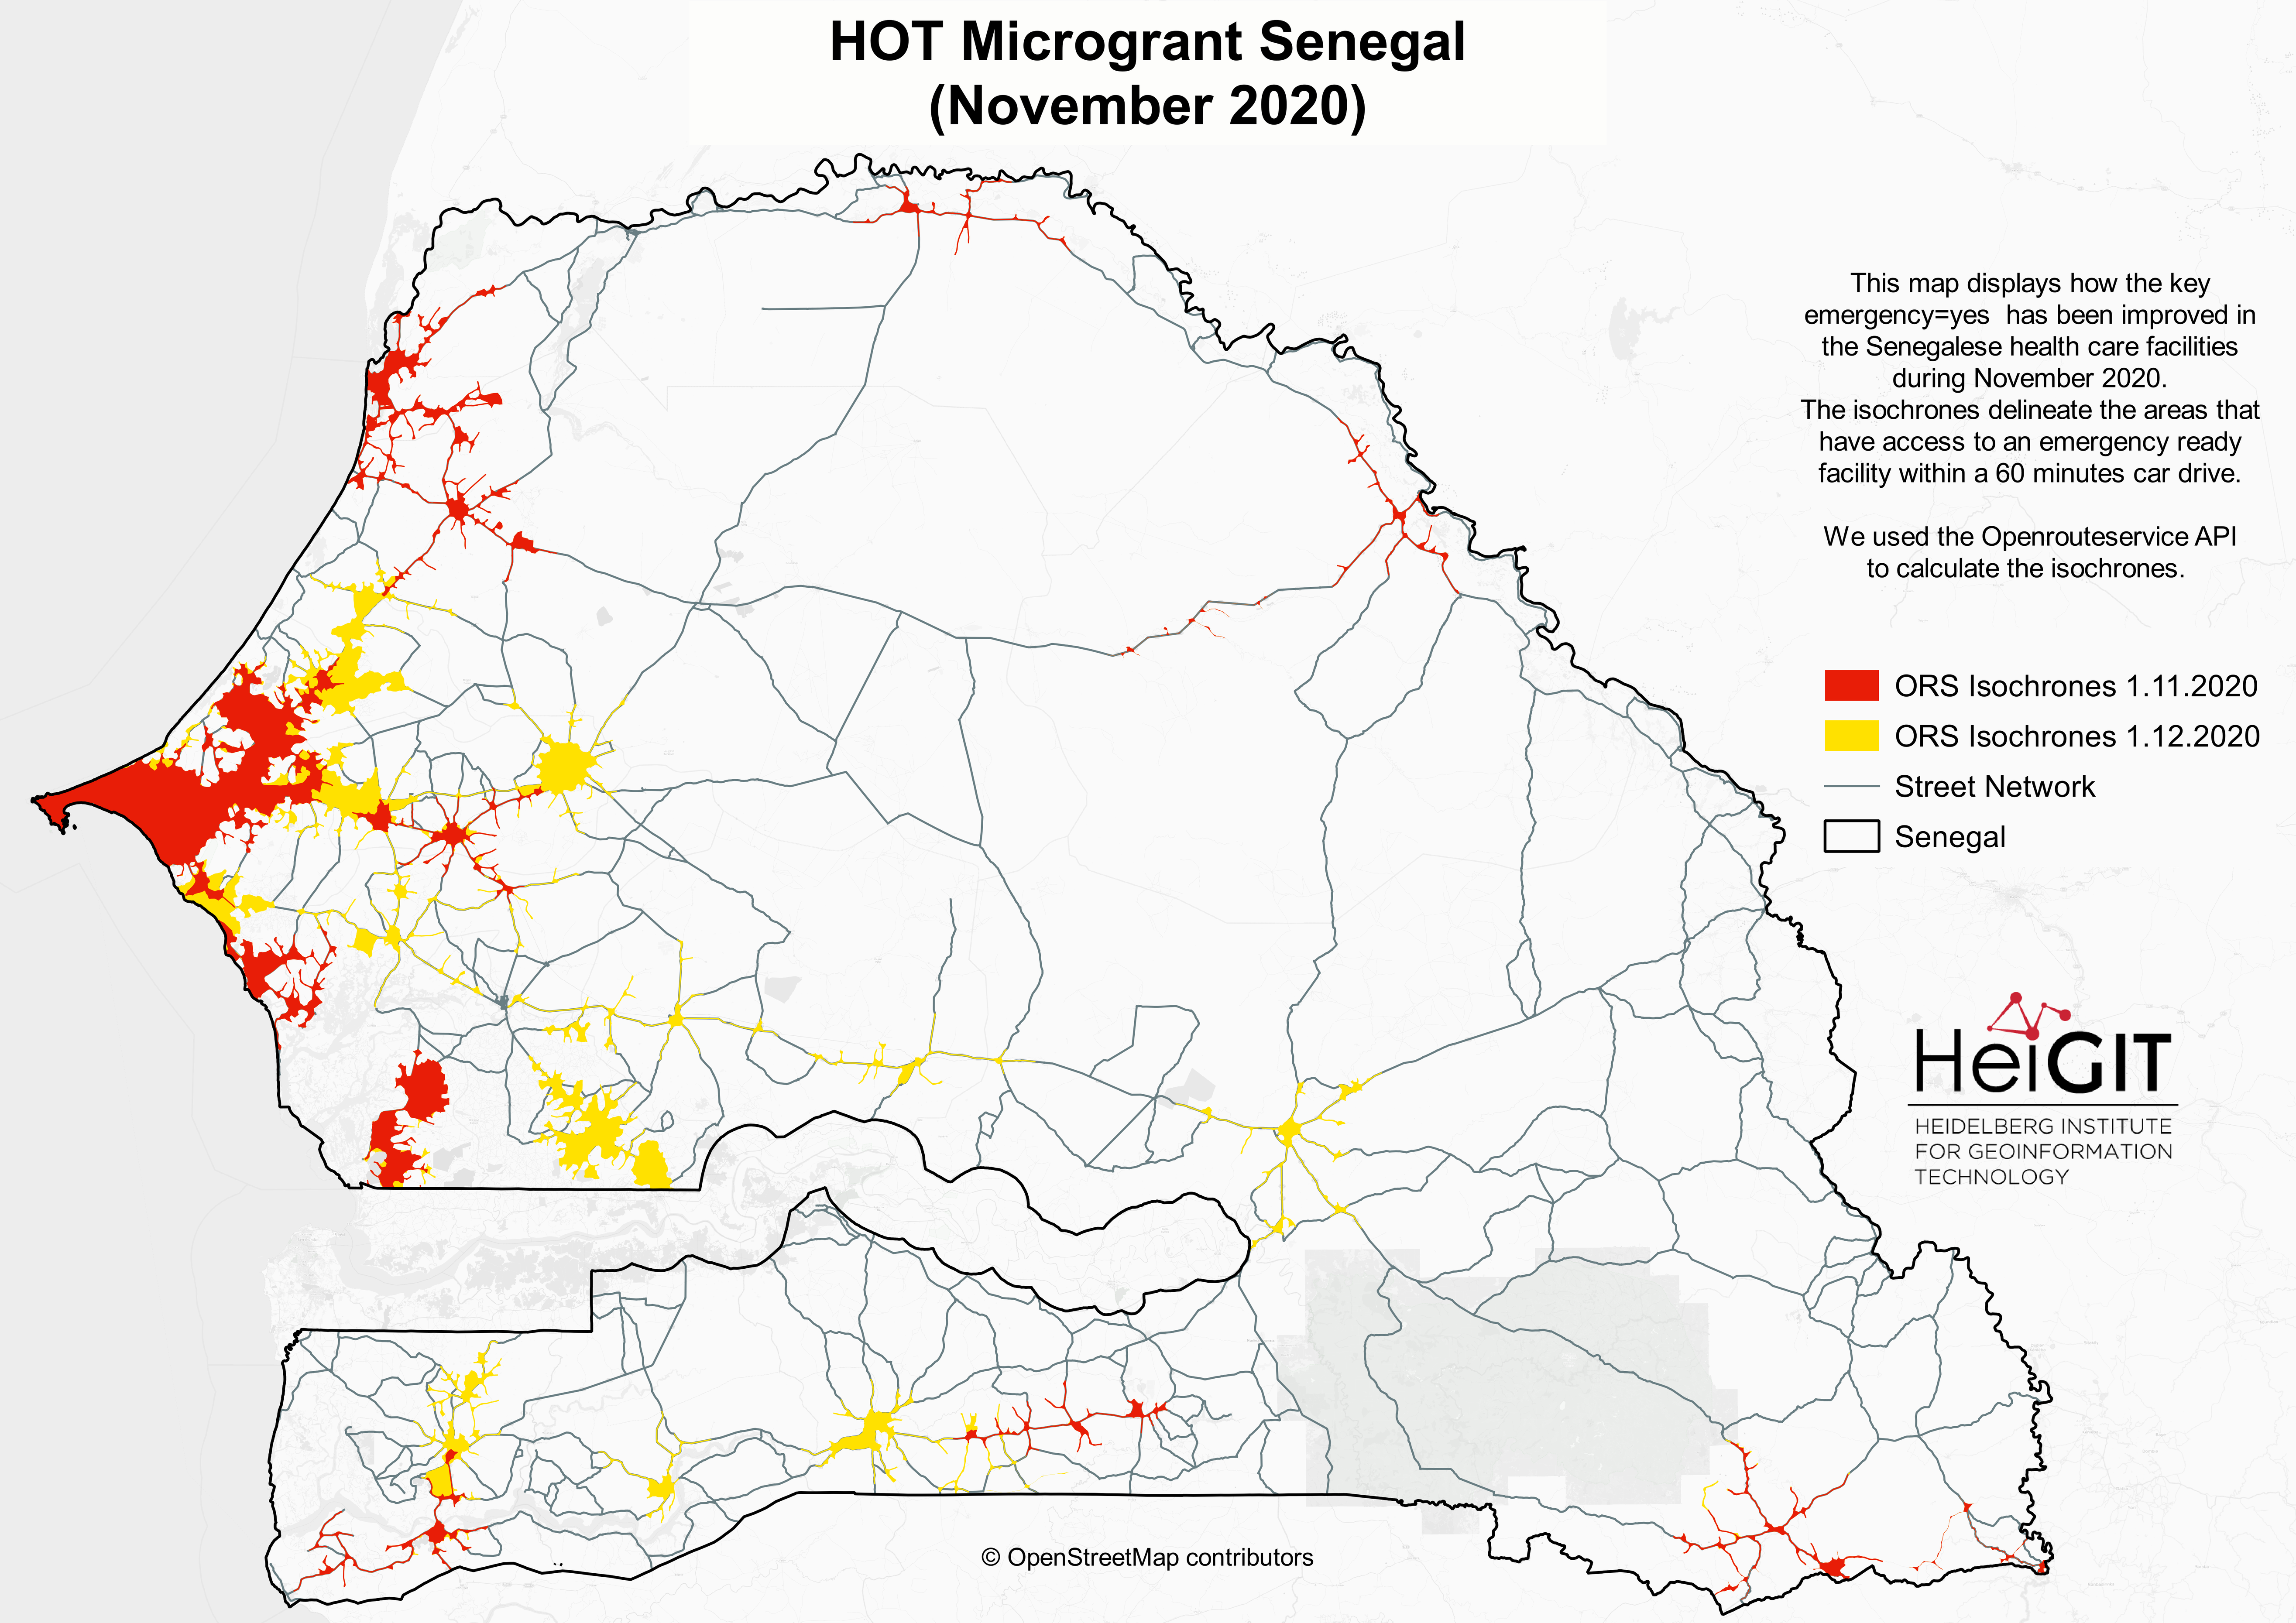
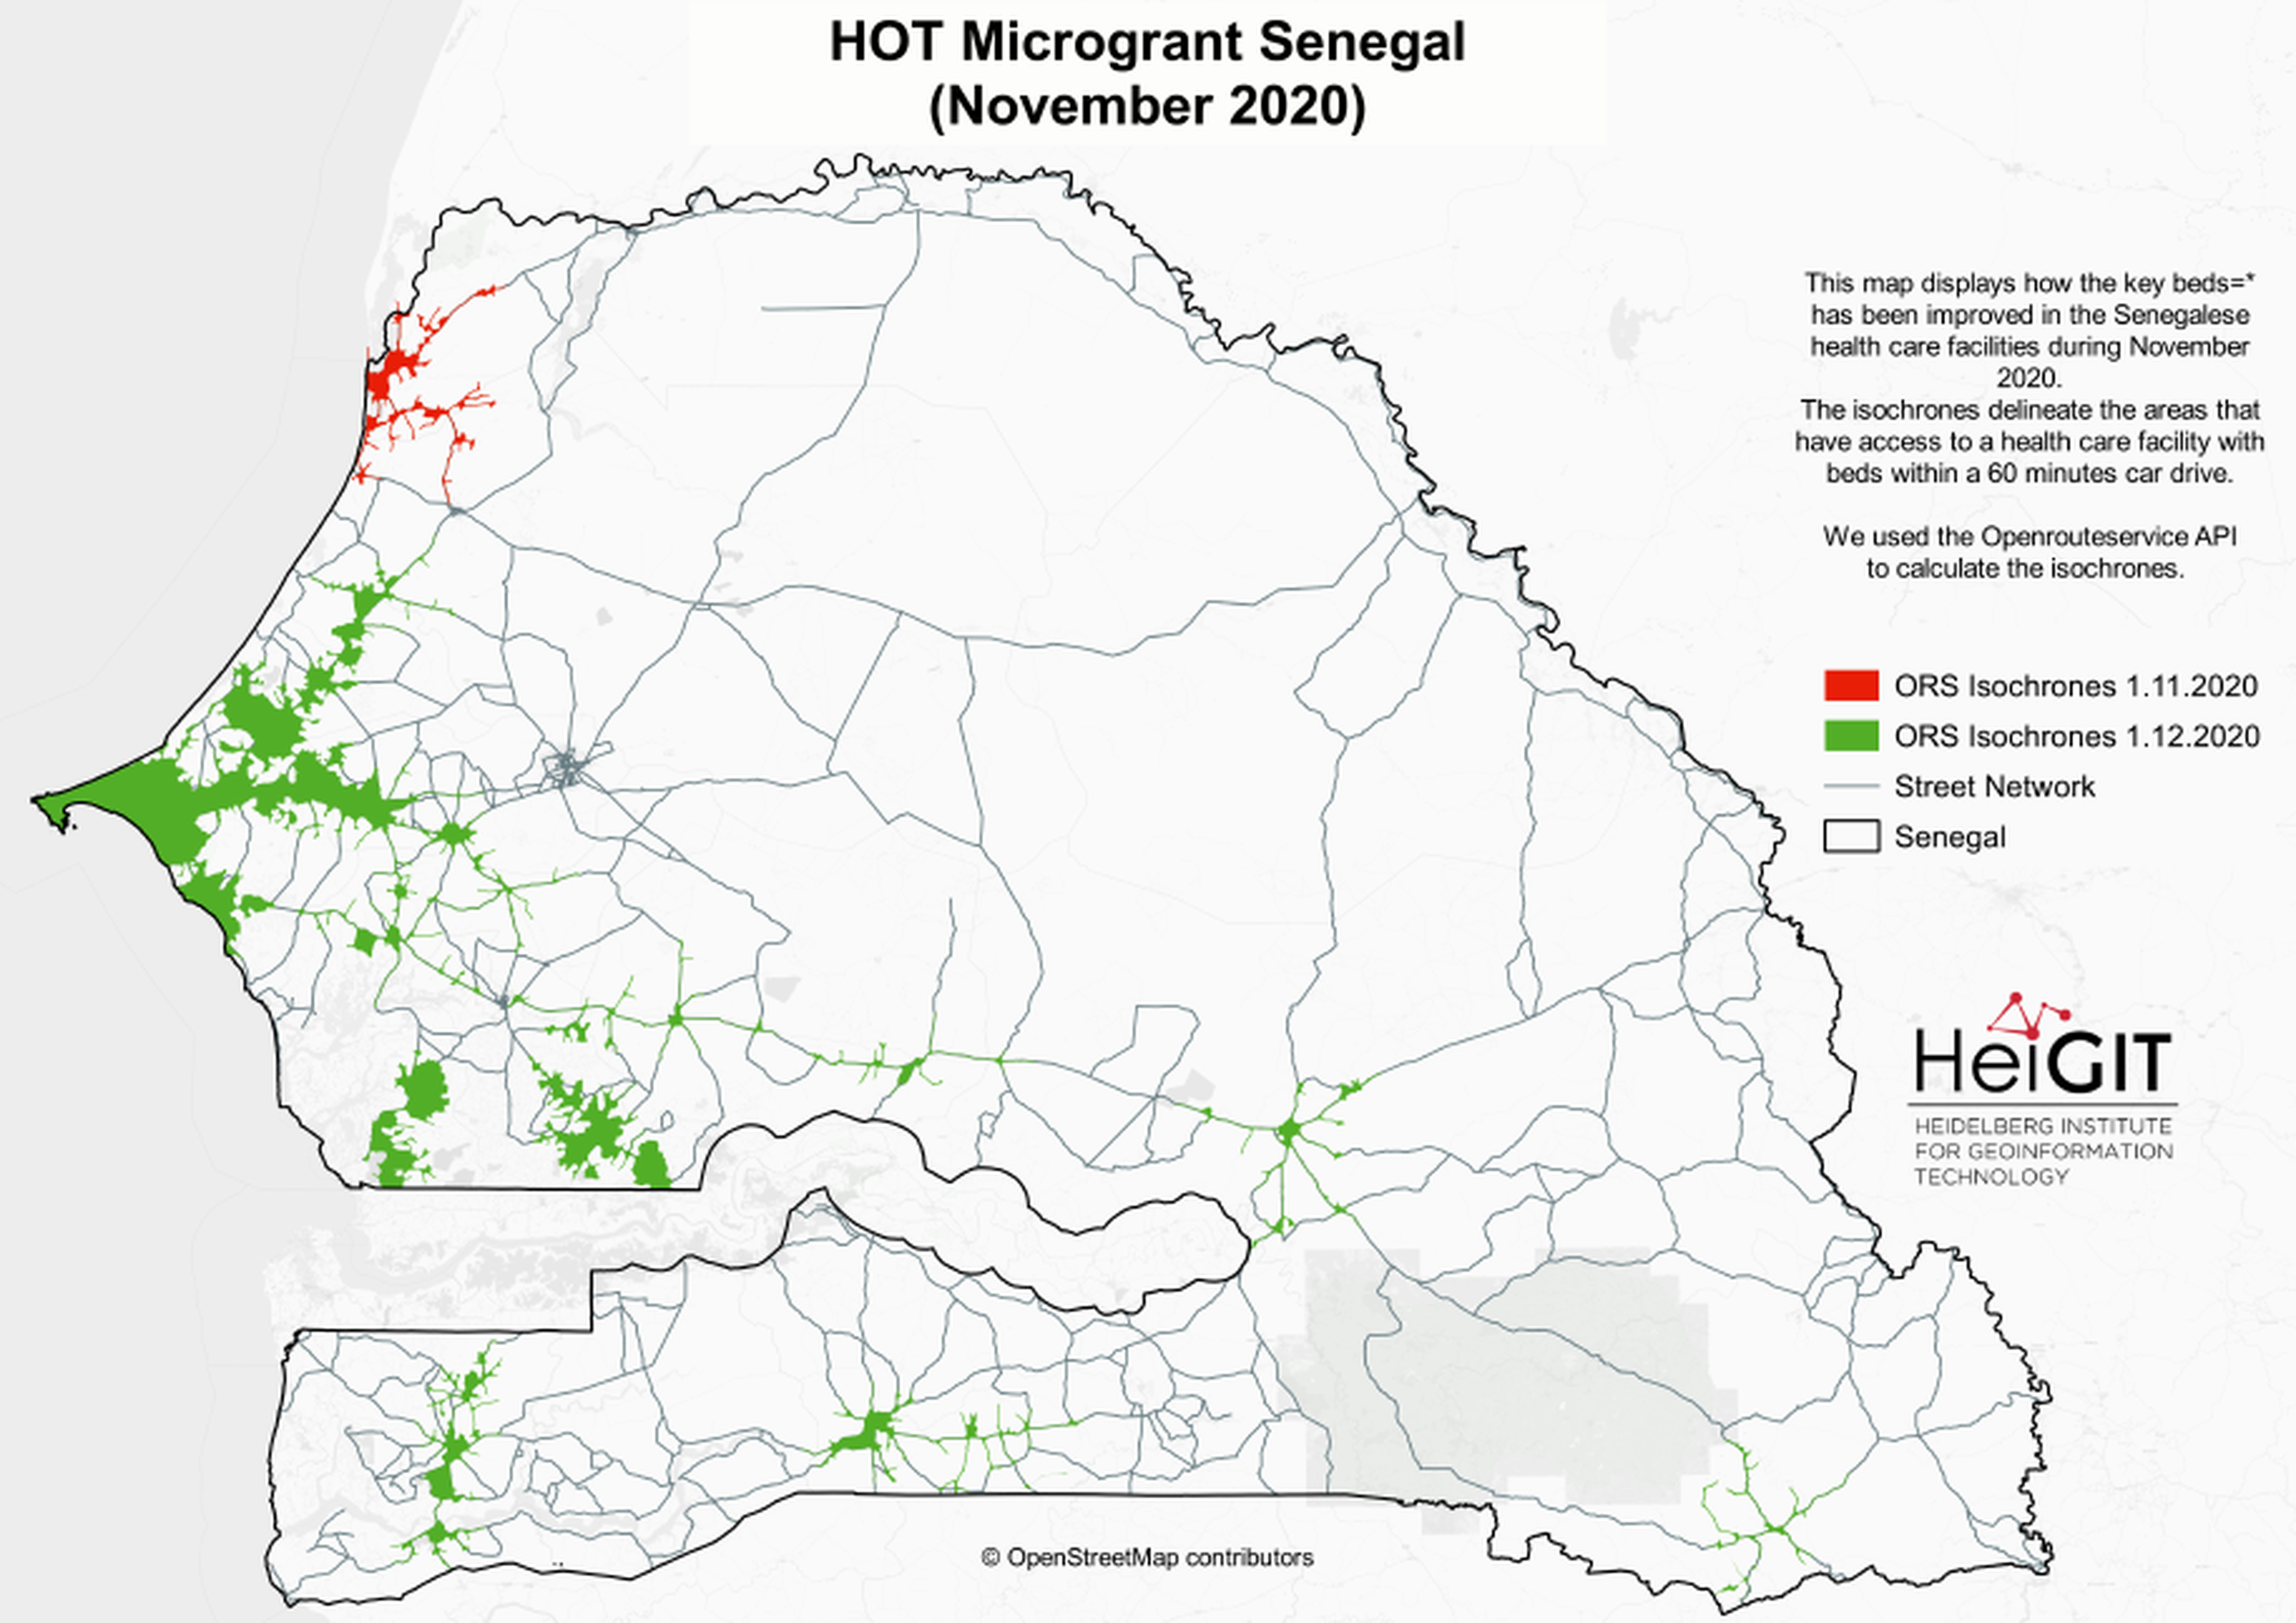
Both maps (Figure 2, Figure 3) show how the availability of critical information can impact secondary information created on top. In just two months time a considerable amount of additional information on capacity and emergency care was added to OSM in Senegal. (Past mapping actions can also be identified. The occurrence of bed tags prior to December 2020 and isochrones based upon this data in figure 3 are linked to another mapping effort in summer 2019).
We used the fetched data grouped by emergency and bed keys to request 60-minutes driving-car profile isochrones to estimate accessibility. We have done this both for all available facilities until November and until December. Figure 2 depicts the results for emergency. Red areas representing accessibility based on information available in November and yellow areas reflecting information available in December. The same procedure was applied in Figure 3 with the key beds=*. However the color scheme for accessibility in December was changed to green. It is apparent that in November, information on beds was only available in the northwest. Since December this information is also available in other parts of the country and thus the calculated accessibility are far greater than before.
Conclusion
Estimating the accessibility of health care facilities using isochrones calculated with the Openrouteservice now closer represents the reality on the ground. It is s important to remark that, changes in the accessibility estimates are most likely not indicative of changes in infrastructure (new facilities, roads). The changes observed rather indicate the increasing presence of information. Crucial healthcare information in an free and open data storage – OpenStreetMap. Further applications, enabled by the data are for example: How many persons have access to a health care facility with an emergency station within a 60 minutes drive. Where are areas that are over- or under-supplied. Where should the next or additional facilities be placed?
As the microgrant project in Senegal could be a pilot for other regions to increase the availability of critical health care data, so can the analyses based in freely and open available data and technology replicated for every region.
Related Work
- Geldsetzer, P.; Reinmuth, M.; Ouma, P. O., Lautenbach, S.; Okiro E. A.; Bärnighausen, T.; Zipf, A. Mapping physical access to health care for older adults in sub-Saharan Africa and implications for the COVID-19 response: a cross-sectional analysis. The Lancet Healthy Longevity. 2020;1(1):e32-e42.
- Openrouteservice API: https://openrouteservice.org/
- Analysing OSM Completeness of health facilities in Sub-Sahara Africa in ohsomeHeX
- Exploring OSM for healthcare access analysis in Sub-Saharan Africa
- New Jupyter Notebook: Analysis of Access to Health Care using openrouteservice Isochrones API
- Recent changes to OpenStreetMap healthcare infrastructure in India
- Mapping physical access to health care for older adults in sub-Saharan Africa and implications for the COVID-19 response: a cross-sectional analysis
- Find the route to your nearest Covid-19 vaccination center in Germany — new App by HeiGIT based on OpenStreetMap and openrouteservice
- Accessibility to pharmacies in Germany with 15km Covid-19 restriction
- Accessibility of covid-19 vaccination centers in Germany