
Since 2010 organized humanitarian mapping has evolved as a constant and growing element of the global OpenStreetMap (OSM) community. With more than 8,000 projects in 150 countries humanitarian mapping has become a global community effort. Due to this large amount of projects, it can be difficult to get an overview on mapping activity. This is why we worked on the “Humanitarian OSM Stats” website to make it easier to find the information you are looking for. It combines data from the open-source Tasking Manager (TM4) hosted by the Humanitarian OpenStreetMap Team (HOT) and information from OpenStreetMap (OSM) that has been processed using the ohsome OSM History Data Analytics Platform developed by HeiGIT.
As one of the founding members of the Missing Maps program, the American Red Cross (AmCross) has used OSM to support their work for the last seven years. Primarily focused on preparedness programs that relate to climate change and natural hazards, the team has also supported MRI vaccine campaigns and many other projects. Over the years, their Missing Maps engagement has grown and they are now hosting almost daily mapathons and engage with 10,000+ mappers annually.
In this post we will focus on validation activity in the HOT Tasking Manager. Validation is an essential part in humanitarian mapping projects for which many beginners do their first map edits in OSM. In the Tasking Manager experience users can mark tasks as validated after a task has been mapped. During this step the so called “validator” either directly fix mistakes (e.g. add missing buildings or correct tagging for highways in OSM) or request that this task should be mapped again by invalidating a task. Once a task has been validated, all data requested by this project should have been completely added to OSM in a correct way. Validation has been in the center of some controversial discussions about humanitarian mapping in the past. Hence, it has gained importance for many humanitarian organizations and some of them are setting up dedicated validator teams or validation events.
The American Red Cross is one of these organizations which has imposed itself to do better when it comes to validation. Over the years, they have hosted a dedicated team of validators in addition to hosting validation focused mapathons. For this piece we will focus on their most recent recruitment efforts. Starting in Fall 2020, the American Red Cross recruited, interviewed, and onboarded 30 new volunteer validators. This group is very diverse in regards to OSM experience, demographics, locations, and skill sets. What unified this group is their shared interest in data, geography, and humanitarian principles.
Officially getting started in January 2021, the group was on-boarded using a three step process. First, volunteers learned about the OSM community, the Missing Maps project, and got familiar with TM4 and its primary editing tool, iDEditor. This was to make sure they understood the new mappers experience. Next, the volunteers transitioned to mapping in JOSM. Last, they became comfortable validating and sharing advice with their fellow mappers. Each class was offered multiple times to accommodate professional and school schedules and time zones. Each class had homework assignments that were discussed at the following class. Two weeks were blocked for each learning module. At the conclusion of their formal learning schedule, weekly Buddy Sessions were held so the group could continue to learn and practice together. Volunteers acted as that week’s Buddy and helped their fellow validator tackle any problems or new learning objectives.
During their time volunteering, monthly check in meetings and guest speakers are also organized for the larger group of volunteer validators. Once confident with the validation activity, monthly goals are set and tracked. We would also like to mention that this group joined forces with a similar program run by the Canadian Red Cross. This partnership was very successful and allowed the mappers to see multiple training styles and mapping behaviors. Next, we will use the humstats website and statistics to check how much progress has been reached already.
Goals
In this blog post we will pursue three relatively easy goals that focus on validation:
- Find out how many people are mapping and validating in the HOT Tasking Manager.
- Check if mapping and validation activities are balanced or skewed.
- Find out who is doing most of the validation work.
How to get the information from the website
- Visit the humstats.heigit.org website and select your organization and click on “go”. This will direct you to a new site with the statistics for the selected organization.
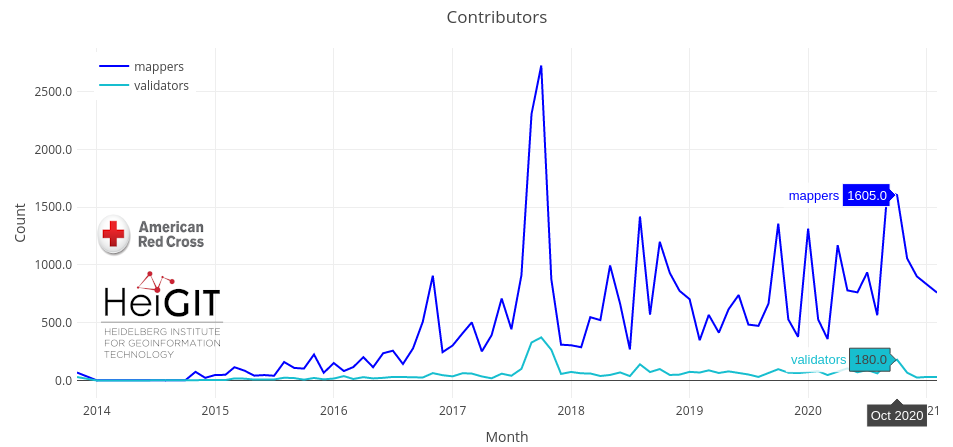
- We then take a look a the Tasking Manager section and navigate to the contributors graph. This plot shows how the activity of the mapping community fluctuates over time. We see that in months with more mappers we usually also see a higher number of validators. In October 2020 a long-term maximum of 180 validators per month have been counted. However, in December 2020 and January 2021 only about 30 volunteers helped to validate tasks in the Tasking Manager. This could be a reflection of a new group getting started and the team focusing on their class 1 learning objectives.
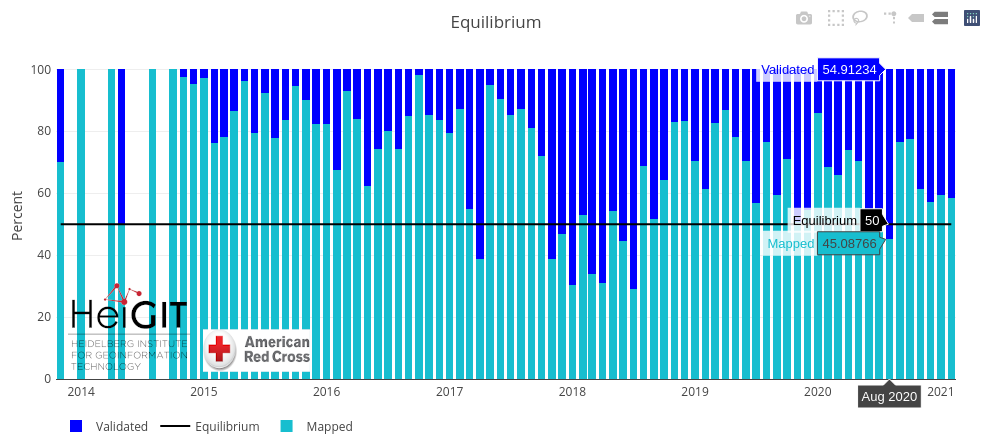
- In the next step we investigate validation performance by comparing the number of tasks that have been mapped against the number of tasks that have been validated. The “Equilibrium” plot shows a dark blue bar for validated and lighter green bar for mapped tasks. We see that in most months more tasks get mapped than validated. But there are also exceptions. Between November 2017 and September 2018 AmCross did really well when it comes to validation. This time period coincides with the creation of their Validation Group. Recently the ratio of mapped and validated tasks seems to have stabilized. For the last four month validation activity accounted for around 40% and mapping for around 60% of AmCross’ overall activity in the Tasking Manager. This time period coincides with a serious uptick in semi-unplanned mapping. As the world settled into a new normal, virtual volunteer events became more and more attractive to larger populations. As we know, it is generally easier to upscale mapping compared to validation. This trend can also be seen following our annual Geography Week events.
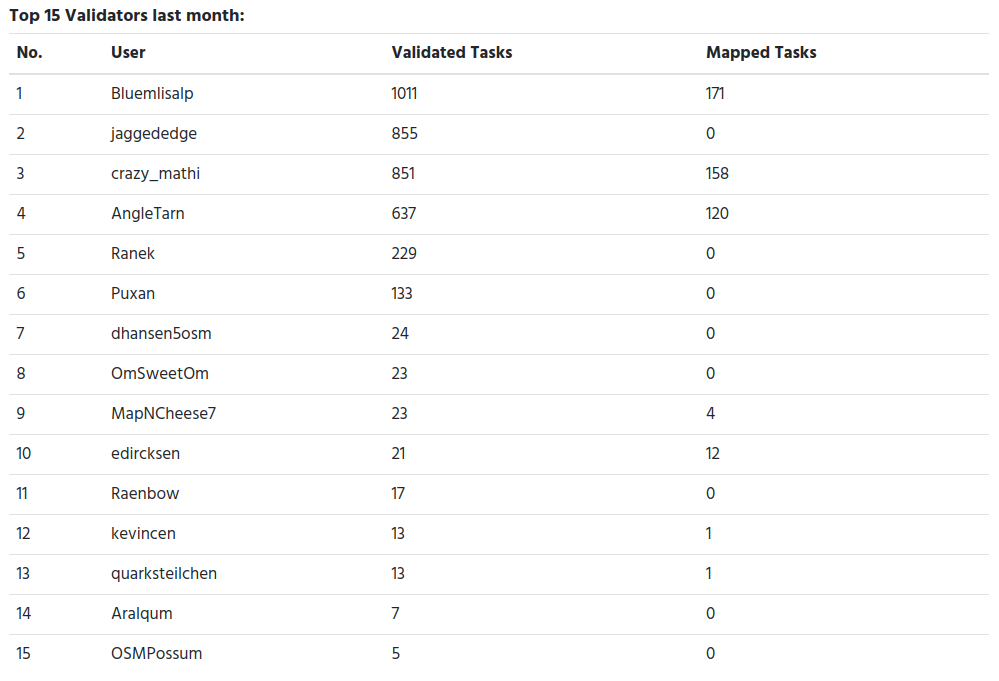
- Finally, to check who is actually doing the validation we scroll down to the users section on the website. We learn that in the last month there have been 6 users who did the major validation work: Bluemlisalp, jaggededge, crazy_mathi, AngleTarn, Ranek and Puxan. Each of these users validated more than 100 tasks in the Tasking Manager. Whereas it is somehow “normal” for a project like OSM that users contribute differently, from an organization perspective it would be good if validation work could be spread on more shoulders. Monitoring these numbers can help AmCross to improve their validation share and find the best way to engage more validators (in such difficult times where in person meetings are not possible).
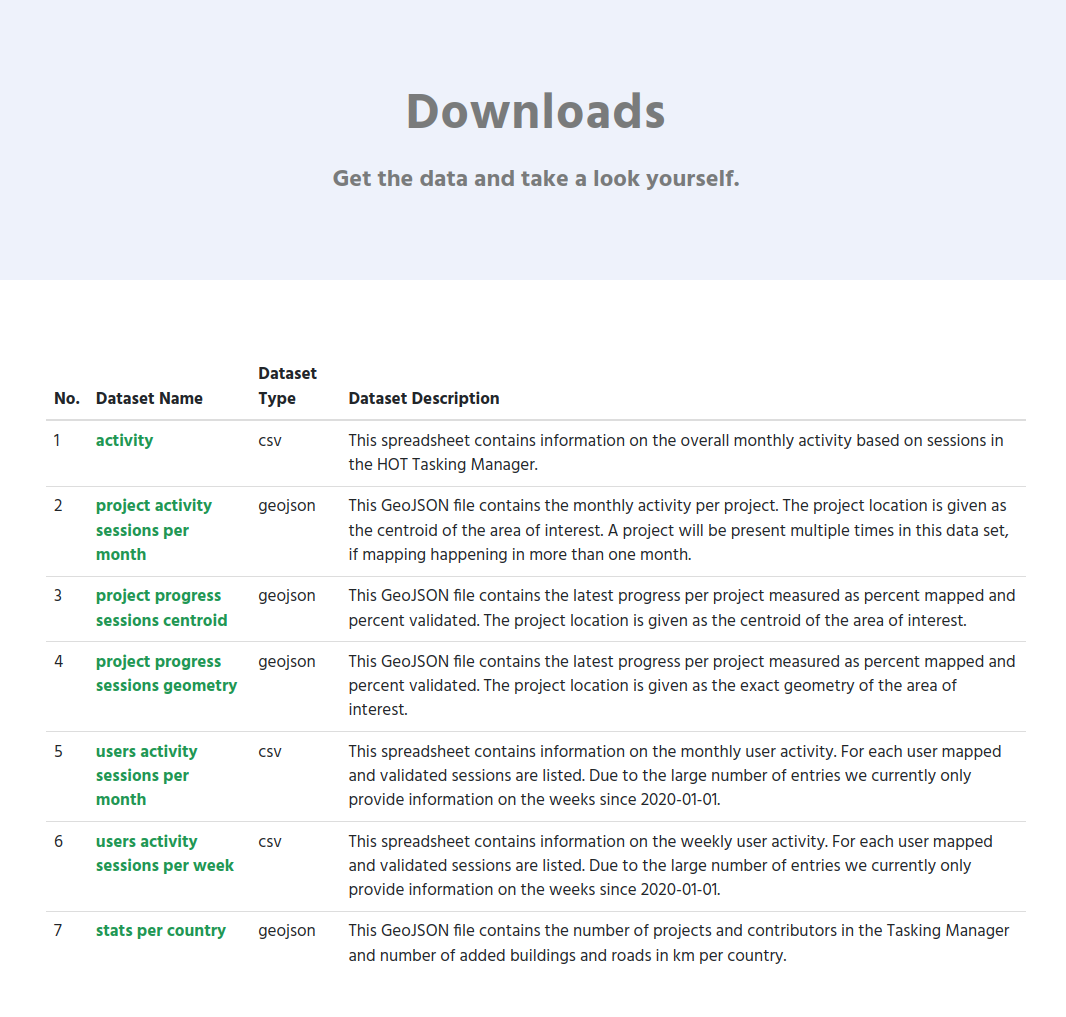
Download the data in a spreadsheet
If you are interested to get the data behind these numbers and plots continue reading. On the website we offer a list of files to download. The activity.csv is the ones that you need for the monthly numbers for mappers, validators and to calculate the share of mapped and validated tasks. The user statistics can be obtained from the user_activity_sessions_per_month.csv file. For instance, for AmCross, this file will be located here: https://humstats.heigit.org/api/export/arc/activity.csv and https://humstats.heigit.org/api/export/arc/users_activity_sessions_per_month.csv.
To be continued
This is the 5th blog post of a series of posts we are currently working on. If you are interested please reach out to us (benjamin.herfort@heigit.org) and we can try to cover your questions in a future post.
We would like to send a big THANK YOU to all of our current validators. Your attention to detail and kind encouragement for our mappers is integral to our work and so appreciated. If you are interested in becoming a validator, please check out the Missing Maps website where new training materials will be added in Spring 2021.
Selected Related Publications
Herfort, B., Lautenbach, S., Porto de Albuquerque, J., Anderson, J., Zipf, A.The evolution of humanitarian mapping within the OpenStreetMap community. Scientific Reports 11, 3037 (2021). DOI: 10.1038/s41598-021-82404-z https://www.nature.com/articles/s41598-021-82404-z
Raifer, Martin; Troilo, Rafael; Kowatsch, Fabian; Auer, Michael; Loos, Lukas; Marx, Sabrina; Przybill, Katharina; Fendrich, Sascha; Mocnik, Franz-Benjamin; Zipf, Alexander (2019): OSHDB: a framework for spatio-temporal analysis of OpenStreetMap history data. Open Geospatial Data, Software and Standards.
Auer, M.; Eckle, M.; Fendrich, S.; Griesbaum, L.; Kowatsch, F.; Marx, S.; Raifer, M.; Schott, M.; Troilo, R.; Zipf, A. (2018): Towards Using the Potential of OpenStreetMap History for Disaster Activation Monitoring. ISCRAM 2018. Rochester. NY. US.
Scholz, S., Knight, P., Eckle, M., Marx, S., Zipf, A. (2018): Volunteered Geographic Information for Disaster Risk Reduction: The Missing Maps Approach and Its Potential within the Red Cross and Red Crescent Movement. Remote Sens., 10(8), 1239, doi:10.3390/rs10081239.