• Home
  • About

GIScience News Blog

News of Heidelberg University’s GIScience Research Group.

Feed on
Posts
Comments
« Mapathon “Mapping for International Solidarity” on 06.04
German Mass Vaccination Sites in Open Healthcare Access Map »

ohsome-py: Python Package for OSM history analytics published

Apr 1st, 2021 by GIScienceHD

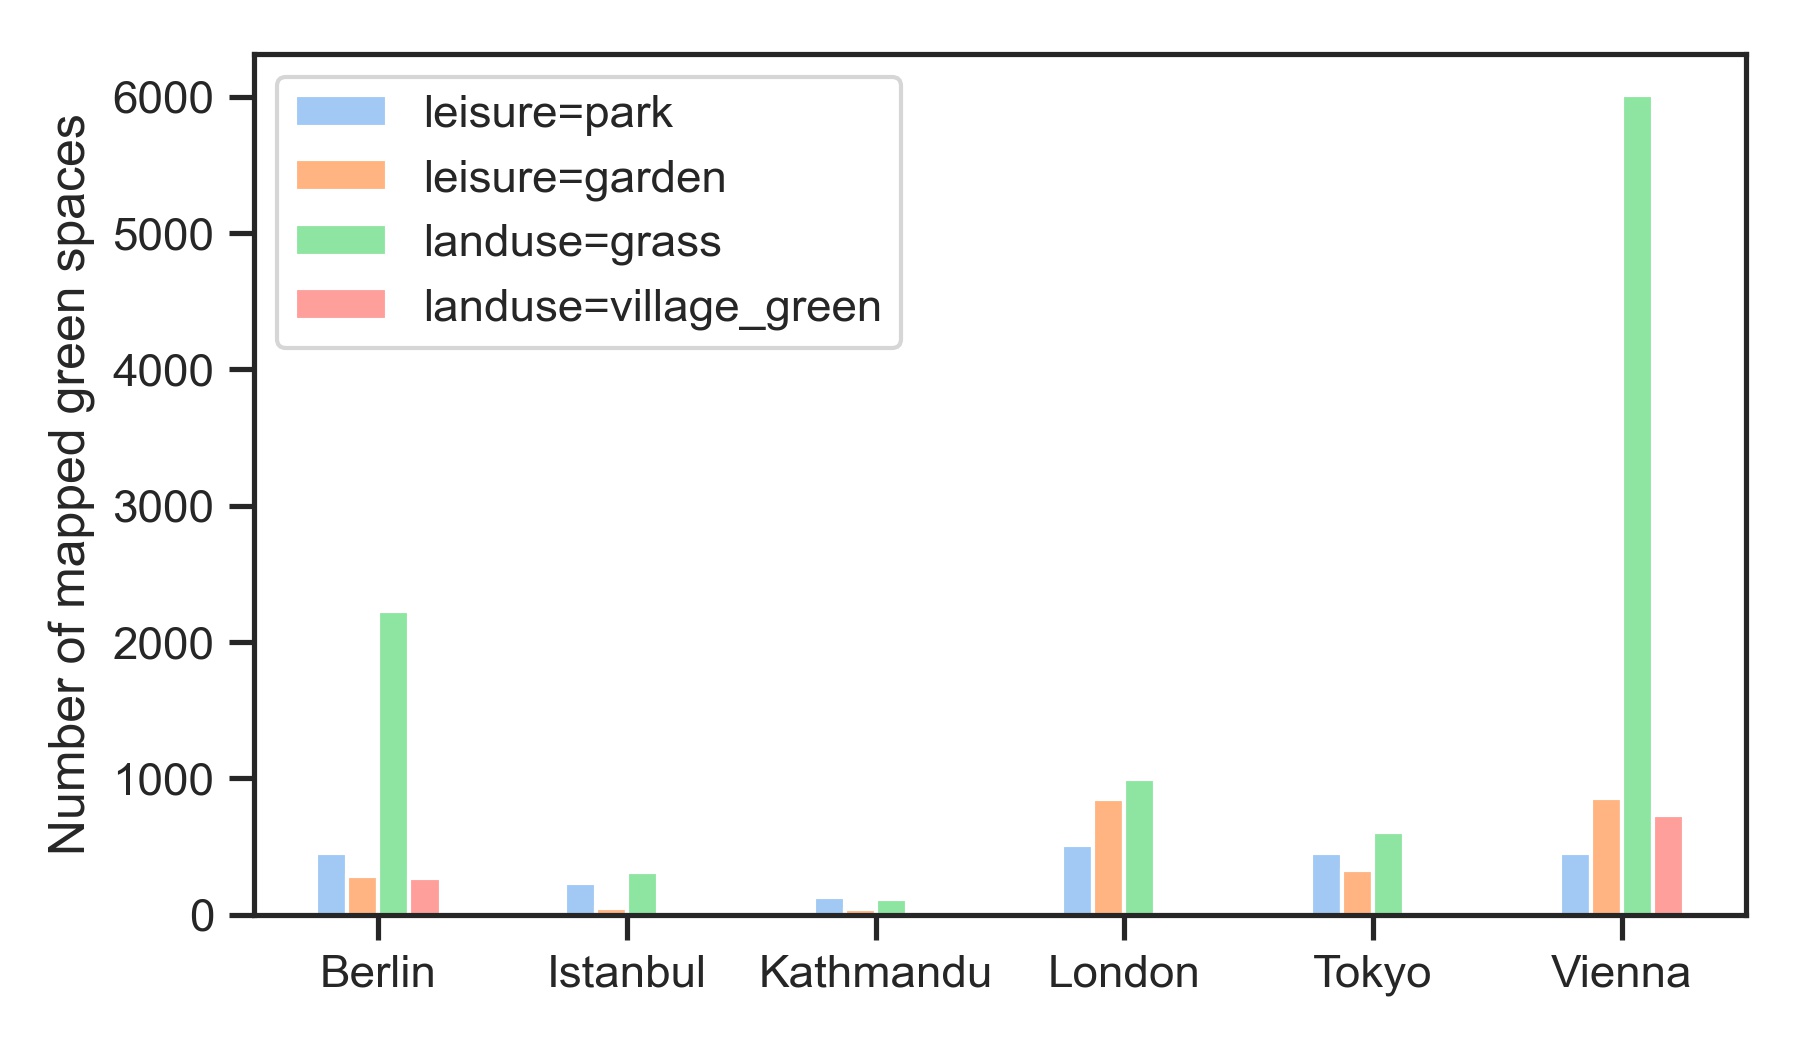
As a little Easter present, we published the first version of the ohsome-py Python package today. ohsome-py helps you extract and analyse OpenStreetMap history data using the ohsome API and Python. It handles queries to the ohsome API and converts its responses to Pandas or GeoPandas data frames to facilitate easy data handling and analysis. In this way, you can use Python’s rich plotting libraries to create figures like the one below with just a few lines of code. Check out this notebook to see how it was produced.

The project is still in an early stage, so there might be quite some changes to the package in the future. To learn how ohsome-py works continue reading below or get started with the tutorial.

Installation

ohsome-py requires Python >= 3.6. Install ohsome-py using pip:

$ pip install ohsome

Usage

Start Python and create an OhsomeClient instance which handles all requests to the ohsome API.

from ohsome import OhsomeClient
client = OhsomeClient()

A simple query to count the number of OSM features tagged as building=* looks like this:

response = client.elements.count.post(bboxes=[8.625,49.3711,8.7334,49.4397],
				      time="2010-01-01/2020/01-01/PY1",
                                      filter="building=* and type:way")

To send a request to one of the ohsome API endpoints append the single components of the endpoint URL as method calls to the client (similar to regular method chaining in Python) and finally call the post() method which contains all necessary query parameters.

To easily analyse and plot the data, the response can be converted to a Pandas DataFrame or a GeoPandas GeoDataFrame if the response contains geometries.

response_df = response.as_dataframe()

Now you can start your own ohsome analysis of OSM history data!

Further info on the ohsome Framework:

Information on the ohsome OpenStreetMap History Data Analytics Platform and more examples of how to use the ohsome API can be found here:

  • ohsome general idea
  • ohsome general architecture
  • the whole “how to become ohsome” tutorials series

Related Literature:

  • Raifer, Martin; Troilo, Rafael; Kowatsch, Fabian; Auer, Michael; Loos, Lukas; Marx, Sabrina; Przybill, Katharina; Fendrich, Sascha; Mocnik, Franz-Benjamin; Zipf, Alexander (2019): OSHDB: a framework for spatio-temporal analysis of OpenStreetMap history data. Open Geospatial Data, Software and Standards.

For some recent work that has been accomplished using ohsome see for example

  • Ludwig, C., Fendrich, S., Zipf, A. (2020): Regional Variations of Context-based Association Rules in OpenStreetMap. Transactions in GIS DOI: 10.1111/tgis.12694
  • Schott, M.; Grinberger, A.Y.; Lautenbach, S.; Zipf, A. The Impact of Community Happenings in OpenStreetMap—Establishing a Framework for Online Community Member Activity Analyses. ISPRS Int. J. Geo-Inf. 2021, 10, 164. https://doi.org/10.3390/ijgi10030164
  • Herfort, B., Lautenbach, S., Porto de Albuquerque, J., Anderson, J., Zipf, A. (2021): The evolution of humanitarian mapping within the OpenStreetMap community. Scientific Reports 11, 3037 (2021).
    DOI: 10.1038/s41598-021-82404-z
  • Auer, M.; Eckle, M.; Fendrich, S.; Griesbaum, L.; Kowatsch, F.; Marx, S.; Raifer, M.; Schott, M.; Troilo, R.; Zipf, A. (2018): Towards Using the Potential of OpenStreetMap History for Disaster Activation Monitoring. ISCRAM 2018. Rochester. NY. US.
  • Wu, Zhaoyan, Li, Hao, & Zipf, Alexander. (2020). From Historical OpenStreetMap data to customized training samples for geospatial machine learning. In proceedings of the Academic Track at the State of the Map 2020 Online Conference, July 4-5 2020. DOI: http://doi.org/10.5281/zenodo.3923040

Tags: become-ohsome, intrinsic quality analysis, ohsome, OSM, OSM History Analytics, python

Posted in Press release, Services, Software, Teaching

Comments are closed.

  • About

    GIScience News Blog
    News of Heidelberg University’s GIScience Research Group.
    There are 1,651 Posts and 0 Comments so far.

  • Meta

    • Log in
    • Entries RSS
    • Comments RSS
    • WordPress.org
  • Recent Posts

    • UndercoverEisAgenten on the road
    • Danziger Scholarship Applications Extended to Aug. 31
    • An ohsome way to check if OSM is up to date
    • HeiGIT at MSF Geo Week 2022
    • Open GIScience PostDoc positions on understanding the relationships between “Urban nature experience, biodiversity and mental health”
  • Tags

    3D 3DGEO Big Spatial Data CAP4Access Citizen Science Climate Change Conference crisis mapping Crowdsourcing data quality deep learning disaster DisasterMapping GeoNet.MRN GIScience heigit HOT humanitarian humanitarian mapping Humanitarian OpenStreetMap team intrinsic quality analysis landuse laser scanning Lidar machine-learning Mapathon MapSwipe Missing Maps MissingMaps ohsome ohsome example Open data openrouteservice OpenStreetMap OSM OSM History Analytics Quality quality analysis remote sensing routing social media spatial analysis Teaching VGI Workshop
  • Archives

    • August 2022
    • July 2022
    • June 2022
    • May 2022
    • April 2022
    • March 2022
    • February 2022
    • January 2022
    • December 2021
    • November 2021
    • October 2021
    • September 2021
    • August 2021
    • July 2021
    • June 2021
    • May 2021
    • April 2021
    • March 2021
    • February 2021
    • January 2021
    • December 2020
    • November 2020
    • October 2020
    • September 2020
    • August 2020
    • July 2020
    • June 2020
    • May 2020
    • April 2020
    • March 2020
    • February 2020
    • January 2020
    • December 2019
    • November 2019
    • October 2019
    • September 2019
    • August 2019
    • July 2019
    • June 2019
    • May 2019
    • April 2019
    • March 2019
    • February 2019
    • January 2019
    • December 2018
    • November 2018
    • October 2018
    • September 2018
    • August 2018
    • July 2018
    • June 2018
    • May 2018
    • April 2018
    • March 2018
    • February 2018
    • January 2018
    • December 2017
    • November 2017
    • October 2017
    • September 2017
    • August 2017
    • July 2017
    • June 2017
    • May 2017
    • April 2017
    • March 2017
    • February 2017
    • January 2017
    • December 2016
    • November 2016
    • October 2016
    • September 2016
    • August 2016
    • July 2016
    • June 2016
    • May 2016
    • April 2016
    • March 2016
    • February 2016
    • January 2016
    • December 2015
    • November 2015
    • October 2015
    • September 2015
    • August 2015
    • July 2015
    • June 2015
    • May 2015
    • April 2015
    • March 2015
    • February 2015
    • January 2015
    • December 2014
    • November 2014
    • October 2014
    • September 2014
    • August 2014
    • July 2014
    • June 2014
    • May 2014
    • April 2014
    • March 2014
    • February 2014
    • January 2014
    • December 2013
    • November 2013
    • October 2013
    • September 2013
    • August 2013
    • July 2013
    • June 2013
    • May 2013
    • April 2013
  •  

    April 2021
    M T W T F S S
    « Mar   May »
     1234
    567891011
    12131415161718
    19202122232425
    2627282930  
  • Recent Comments

    GIScience News Blog CC by-nc-sa Some Rights Reserved.

    Free WordPress Themes | Fresh WordPress Themes