
Hello and welcome back to part 12 of our “How to become ohsome“-blog post series! If you’re new to this series, check out other blog posts of the series as well, in order to learn how you too, can become ohsome using the ohsome API!
This time, we want to take a closer look at the filter options area and length (please keep in mind that we are talking specifically about filter options and not about the endpoints of the same name)
For this, we’ll take a closer look at the tags building=school, for the area-filter, and junction=roundabout, for the length-filter. As geographical boundaries we chose Brazil and got our data from here.
Requests
For this blog post’s requests, the filter conditions are of special interest. To be able to show what area:(from..to) and length:(from..to) do, we sent two requests for each, one with the condition included and one without so we could compare overall values with the filtered ones. We chose the endpoint elements/count to retrieve a number of objects that we could work with. Concerning the temporal aspect of our requests, we decided that getting the values from 2018 to 2021 was sufficient to present the use of the filter option.
Data Exploration
Length Filter Option
In this example, all junction=roundabout objects with a length ≤10 meters should be considered (see r1.1). As aforementioned, an additional query was sent that displays all objects based on the same endpoint in order to visualize the filter option (see r1.2). We then proceeded with a short analysis of the output data to visualize the differences in the output of the requests sent.
r1.1: filter=type:way and (junction=roundabout and length:(10..))
r1.2: filter=type:way and junction=roundabout
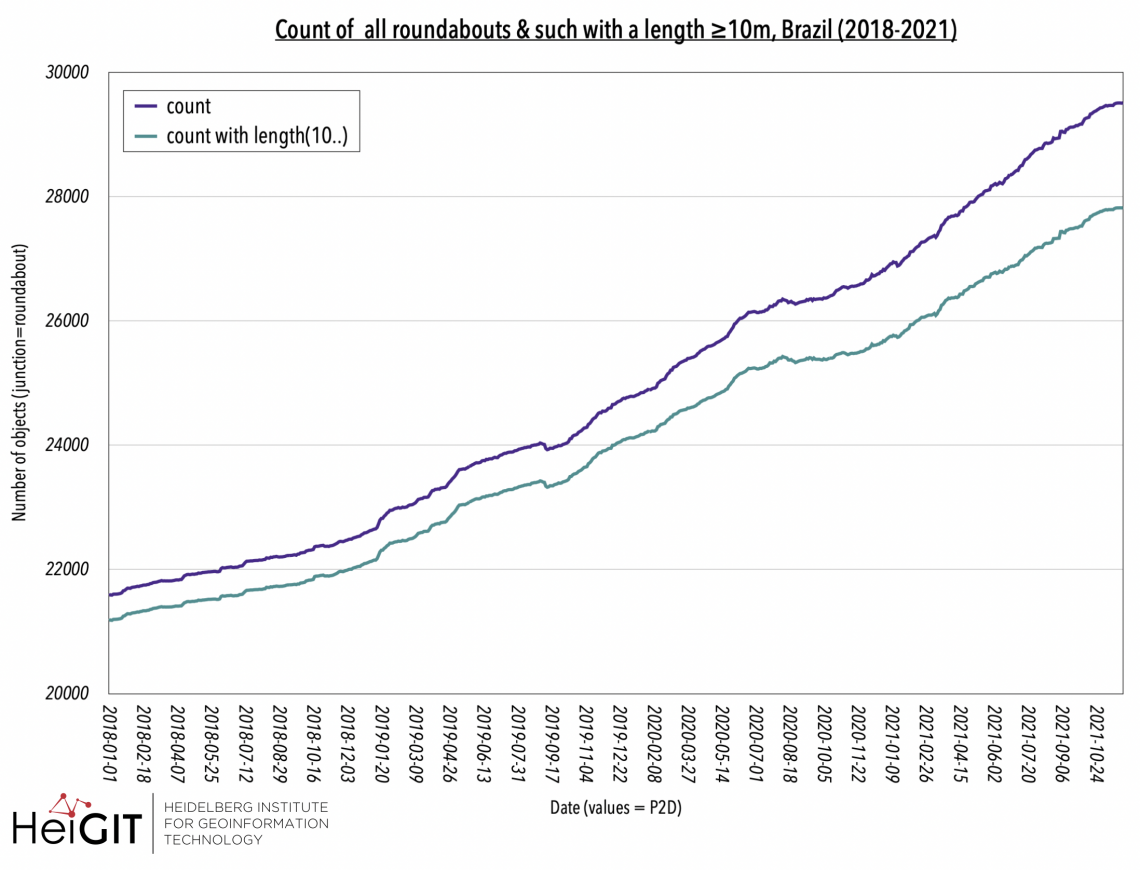
Here you can see a figure which displays the count of all junction=roundabout-objects as well as the filtered ones with a length ≥10m in Brazil from 2018 – 2021.
As to be expected, the values with the filter option are below the total values. Apart from a few minor collapses, there are no sudden developments displayed in the figure which itself displays a more or less continuous increasing trend.
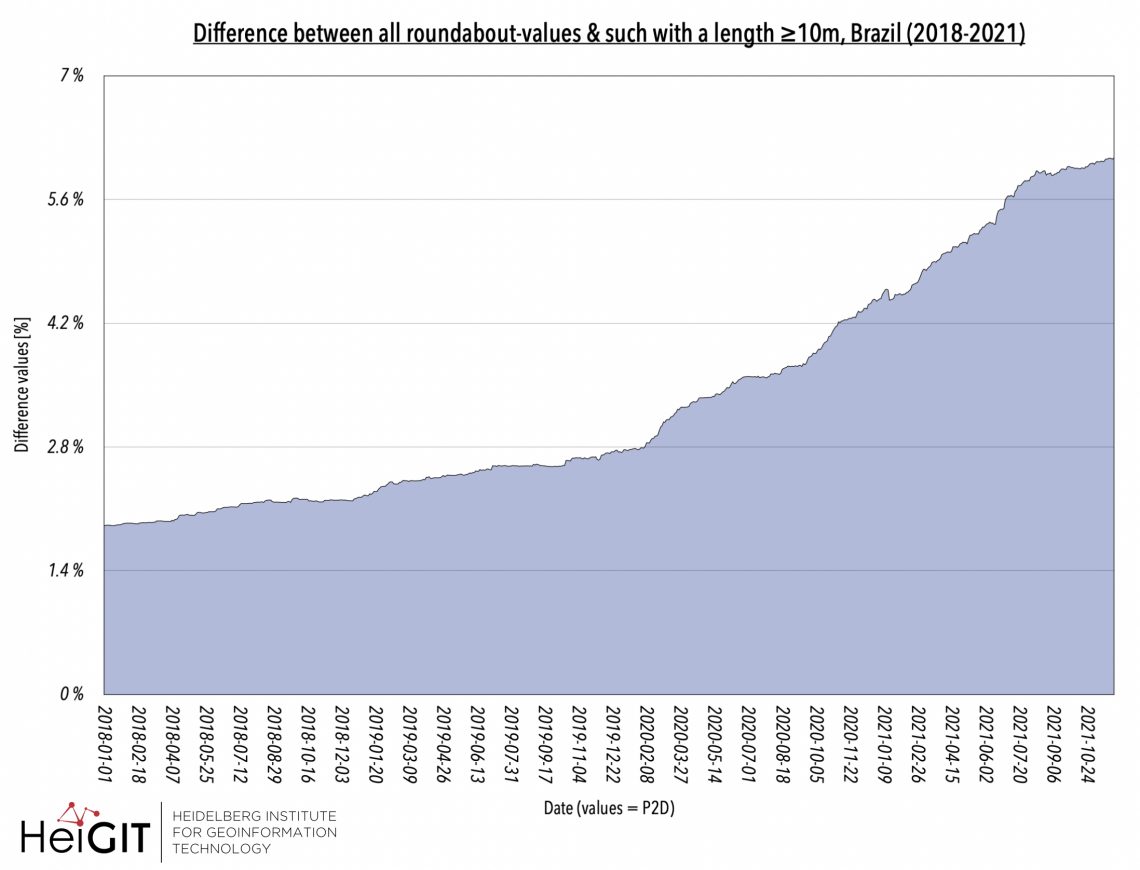
Here you can see a figure which displays the difference between all junction=roundabout-objects and the filtered ones with a length ≥10m in Brazil from 2018 – 2021.
From the figure you can gather an increasing difference between the absolute count values and roundabouts with length ≥10m, i.e. more roundabouts with length ≤10m were added over the course of time. Since about February 2020, the difference increased somewhat stronger than during the previous time period.
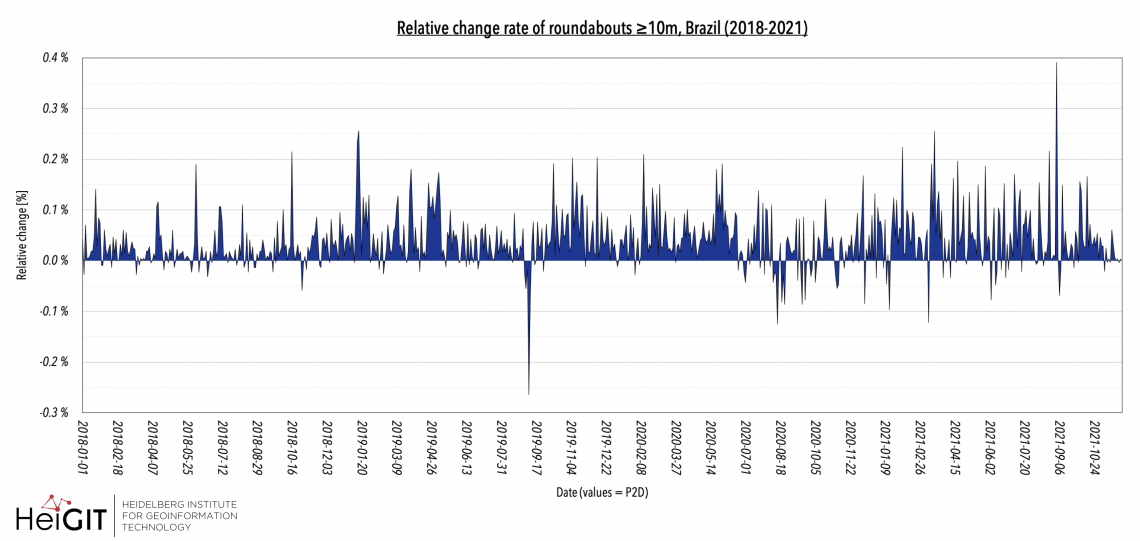
Here you can see a figure which displays the relative change rates of junction=roundabout-objects with a length ≥10m in Brazil from 2018 – 2021.
In the figure you can see the relative change rate of the amount of roundabouts ≥10m in Brazil. Although positive relative changes are predominant, there is also a small number of significant declines. For example, throughout the year 2020, there were quite strong increases, however values declined again in summer 2021.
Area Filter Option
To give an example of the filter option area, we decided to take all school buildings* smaller than 1500m2 into account (see r2.1). Again, we sent an additional request to get the overall values (see r2.2)
r2.1: filter=type:way and building=school and area:(.. 1500)
r2.2: filter=type:way and building=school
*Please note that in OpenStreetMap there is usually a difference between school grounds (so including outdoor area as well, addressed via amenity=school) and school buildings (addressed via building=school). For more information see here.
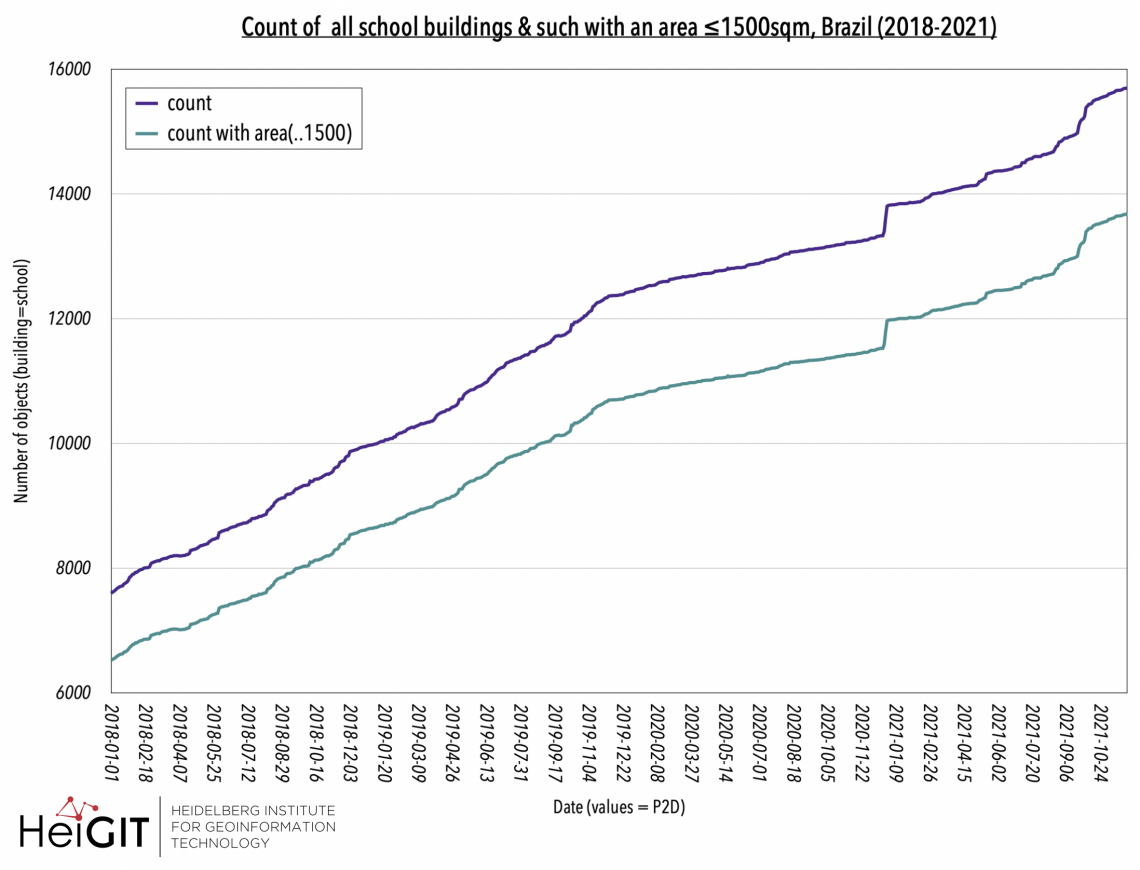
Here you can see a figure which displays the count of all building=school-objects as well as the filtered ones with an area ≤1500m2 in Brazil from 2018 – 2021.
As can be seen in the figure, the development shows an increase without any major collapses, however, with a prominent leap towards the end of December 2020 following a slightly more leveled growth over the year 2020.
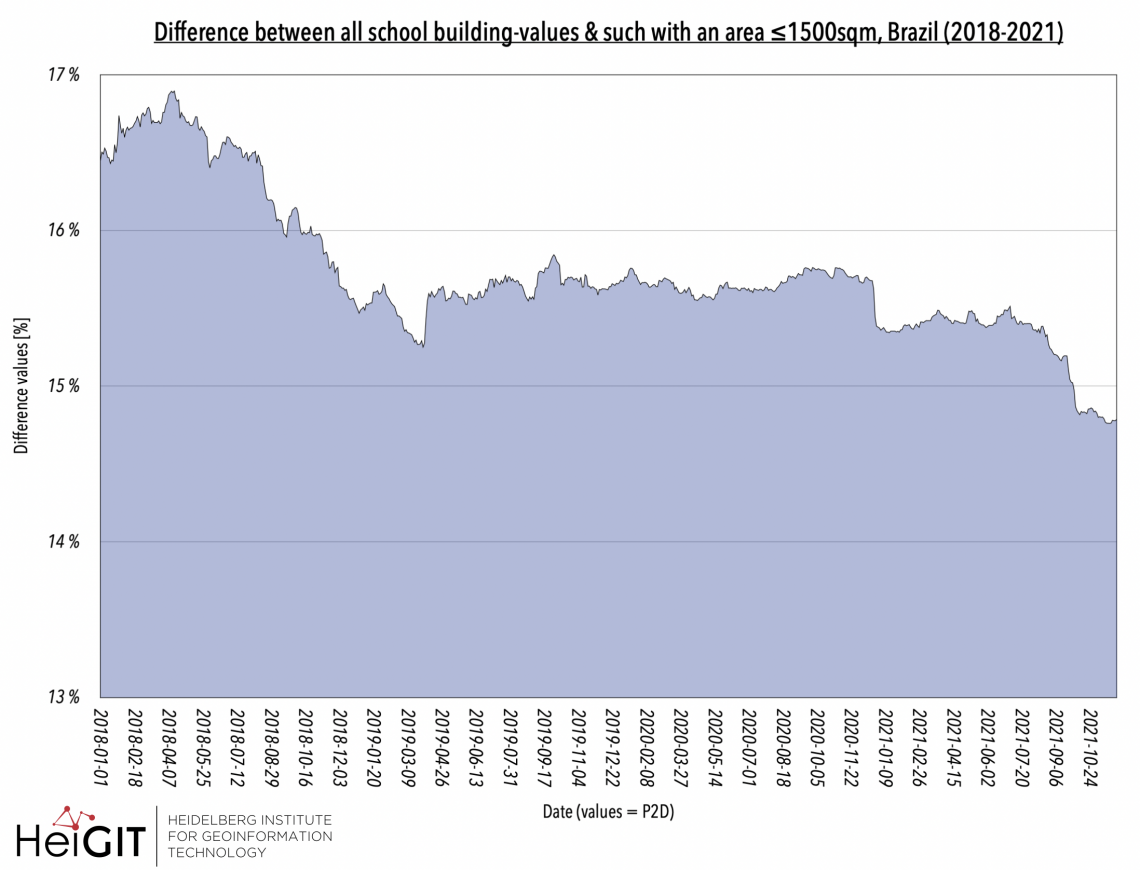
Here you can see a figure which displays the difference between all building=school-objects and the filtered ones with an area ≤1500m2 in Brazil from 2018 – 2021.
When taking the percentage values into consideration, the difference decreases on average throughout the years, although it rises in terms of absolute values. This could be due to the fact that the relationship of the count values (overall and filtered) to each other is more pronounced in this percentage value.
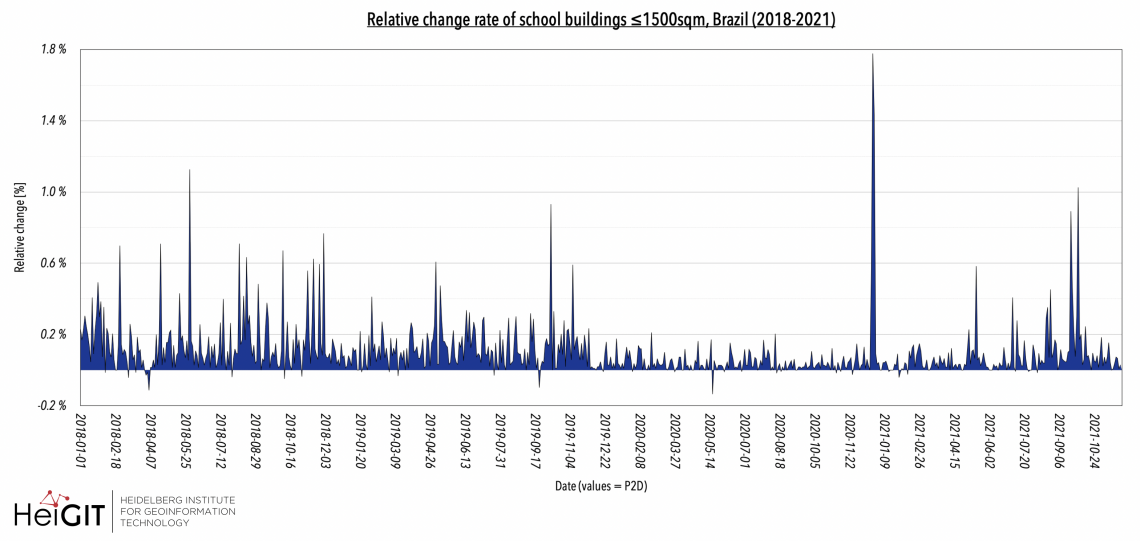
Here you can see a figure which displays the relative change rates of building=school-objects with an area ≤1500m2 in Brazil from 2018 – 2021.
The previously described maximum subsequent to a weakened development throughout 2020 is also visible in the relative rate of change, where one can observe how the values drop noticeably from around December 2019 onwards, only to gradually increase once more following the peak.
Thank you for reading our newest addition to the “How to become ohsome“-series! Stay tuned for more blog posts concerning the ohsome API.
Background info: the aim of the ohsome OpenStreetMap History Data Analytics Platform is to make OpenStreetMap’s full-history data more easily accessible for various kinds of OSM data analytics tasks, such as data quality analysis, on a regional, country-wide, or global scale. The ohsome API is one of its components, providing free and easy access to some of the functionalities of the ohsome platform via HTTP requests. Some intro can be found here:
- ohsome general idea
- ohsome general architecture
- how spatial joins queries work in the OpenStreetMap History Database OSHDB