
Introduction
Since the release of the ohsome quality analyst (short OQT) in February of last year, we have been working on developing an accessible yet powerful toolkit which provides end users insights on the quality of OpenStreetMap (OSM) data. An overview of the functionality additions made to OQT over this period of time can be found in the changelog. However, for this blog post, we wish to introduce one of the new major additions to OQT from release 0.10.0, the new Building Completeness Indicator. Before diving in on how to use the new indicator in practice, the underlying principles on how the indicator has been constructed will be discussed, as to facilitate an understanding behind the working of the Building Completeness Indicator.
Building Completeness Indicator – The Concept
The core functionality of the Building Completeness Indicator is to use proxy variables to predict an expected building area in a given area of interest (AOI) and to compare this prediction to the current building area mapped in OSM. The prediction is based upon a number of covariates which include; population and population density, settlement typologies, (both based on the Global Human Settlement Layer: GHSL GHS-POP R2019A, GHSL SMOD R2019A), the subnational Human Development Index and nighttime lighting as a degree of urbanity (EGO – Nighttime Lights VNL V2).
The indicator relies on a Random Forest Regressor and the prediction is performed on a hexagon grid basis. As such, your AOI is split into several smaller grid cells. The overall completeness is derived as the weighted average of all the hex-cells, where the weights are defined by the predicted building area. For release 0.10.0, the new indicator only provides reliable results within Africa, as the building data set (Open Buildings by Google) used to train the Random Forest regressor is limited to Africa. However, in future releases we plan to extend our coverage by using multiple open data sets such as the ones provided by Microsoft.
Building Completeness Indicator – In Use
By using a small case example, it is possible to observe how this weighted average operates in determining “building completeness“. The aim of this small case example is to determine the Building completeness for Lesotho. Lesotho is prone to droughts, our hypothetical research analysis is thus aiming to determine which population centres have access to plumbing and which areas do not. For doing so, we would like to establish what the quality of OSM building data is in Lesotho, in which building completeness acts as a relevant factor.
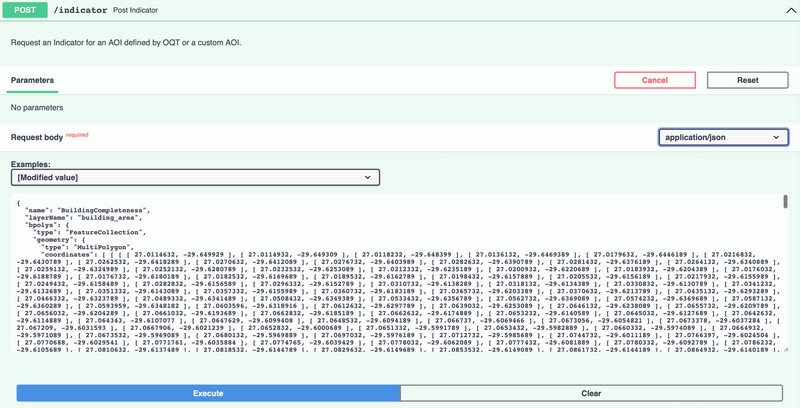
Fig. 1: Calling the Building Completeness Indicator in an API POST request (/indicator) in the web Application
It is possible to access the Building Completeness Indicator in either the web application or Command Line Interface. Using the web application, it is possible to call the indicator by defining building_area as layer.name in an API POST request (/indicator) with a custom AOI within Africa (in this case Lesotho). When wanting to obtain a visual report it is possible to request an SVG (“includeSvg”: true) and, since release 0.9.0 it is also possible to request a HTLM snippet (“includeHtml”: true). When having executed the API request, the response should look similar to the figure below.
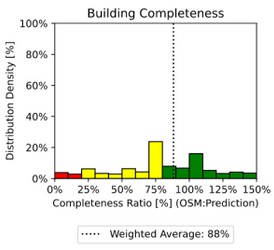
Fig. 2: Building Completeness Graph
For the bounding box of Lesotho, we observe a variability in building densities which is relevant for the weighted average given due to how the prediction is executed, namely per hex-cell. If hex-cells which show low building count with a low total building area mapped in OSM compared to the predicted building area, then they should weigh in less heavily as hex-cells with a low completeness ratio and a larger number of buildings.
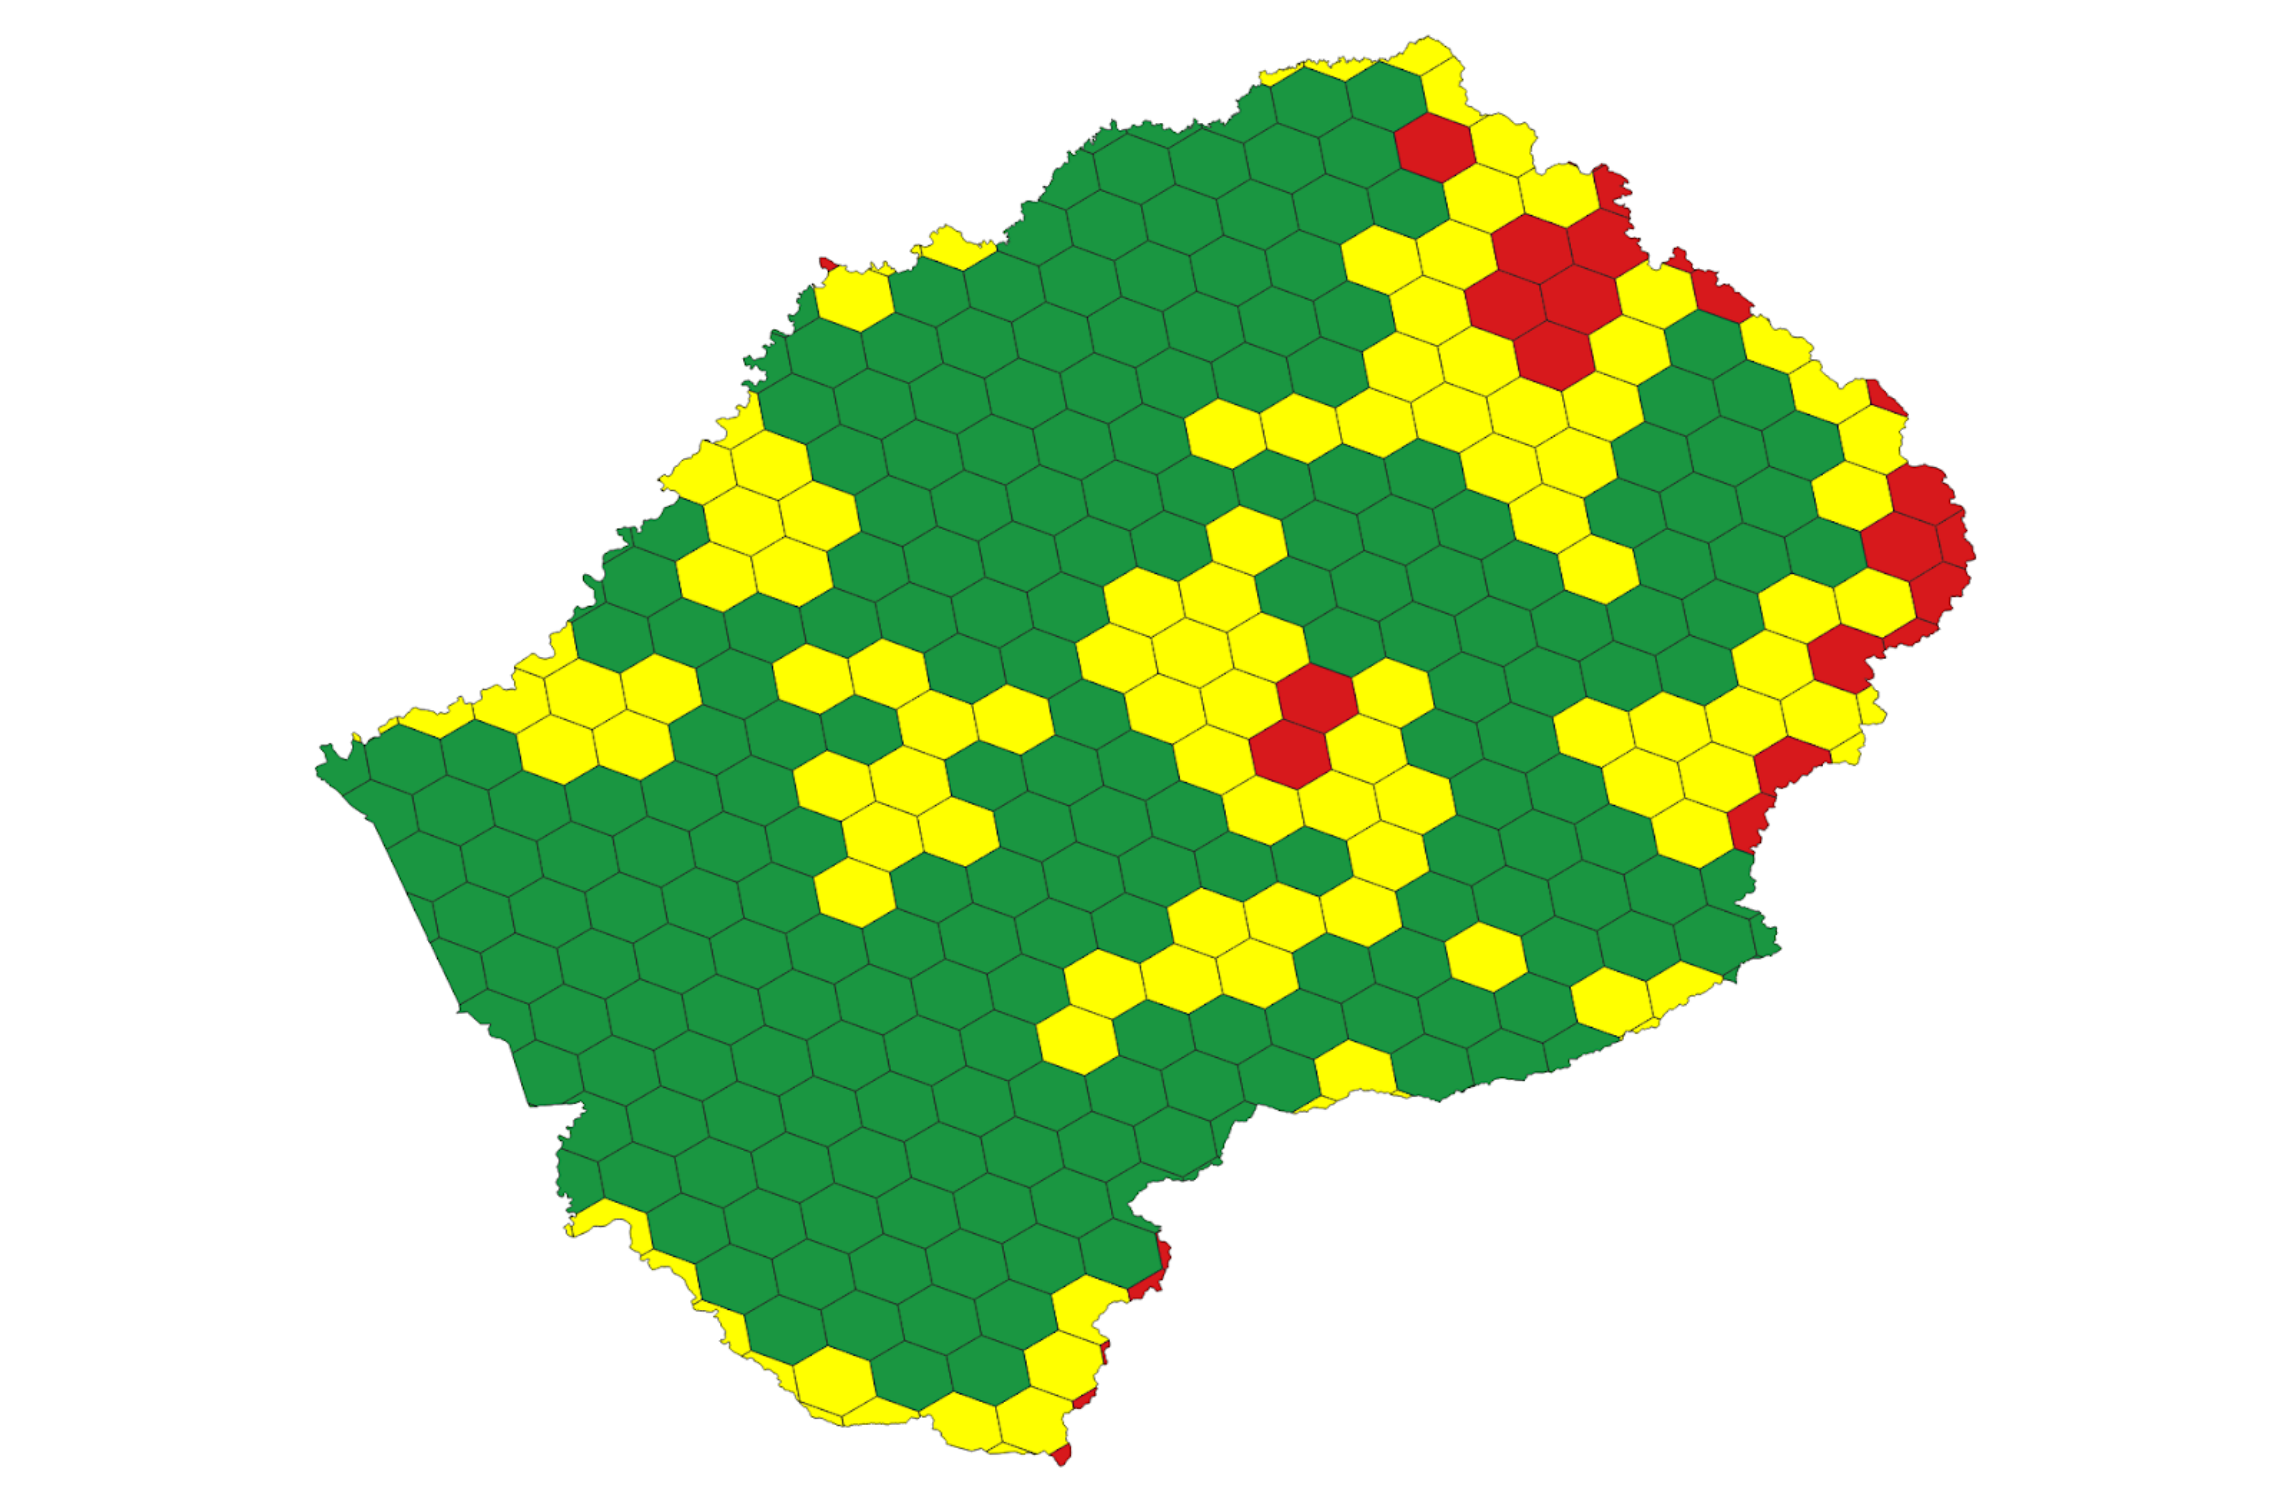
Fig. 3: A visual such as presented in the figure above is not produced in standard API requests.
In the figure above it is possible to observe that although there are a number of hex-cells which show a low completeness ratio, they only represent a small area of the total building area and thus play less role in the weighted average than the hex cells which present a completeness ration between 80 – 90 %, as they amount to a larger percentage of the total building area.
For our hypothetical case example, the results imply that overall a high degree of building completeness can be determined for Lesotho, as the report states, a weighted average of 88%. It seems that hex-cells that have a higher degree of urbanity and thus a higher share of the total building area are relatively well mapped in OSM compared to a number of hex-cells which occupy a lower share of building area. This could imply, for the research team, that the quality of OSM data in some rural areas is lacking. When combined with other OQT tools and other services based on the ohsome framework such as ohsomeHeX, the research team could get further insights on the quality of OSM data in the region, which could provide useful insights into how to develop a methodology or interpret their conclusions.
Final Notes
In addition to those new features to OQT various smaller changes have been made, all to be found in the changelog. A recent addition, from release 0.10.1, allows the user to request a “Multilevel Mapping Saturation” report which indicates the mapping saturation of four Map Featuressimultaneously. If you have any ideas, feedback or would like to contribute to OQT feel free to contact our team via ohsome@heigit.org. OQT is Open Source and the development is done on GitHub, where contributions are welcome.
The further development of OQT of course does not end here. We have a couple of interesting new additions in the pipeline, including, as mentioned earlier, an expansion in the use cases for the Building Completeness Indicator, where multiple data sets will be utilised to allow worldwide access.
Related Work
OQT relies on OSM data processed by the ohsome framework developed at HeiGIT. The aim of the ohsome framework is to make OSM’s full-history data more easily accessible for various kinds of data analytics tasks, such as data quality analysis, on a regional, country-wide, or global scale. Here you find a list of related blog posts and publications:
Further Reading on the Building Completeness Indicator
- Sirko, W., Kashubin, S., Ritter, M., Annkah, A., Bouchareb, Y. S. E., Dauphin, Y. N., Keysers, D., Neumann, M., Cissé, M., & Quinn, J. Continental-Scale Building Detection from High Resolution Satellite Imagery. CoRR, abs/2107.12283.
- Dijkstra, L., Florczyk, A. J., Freire, S., Kemper, T., Melchiorri, M., Pesaresi, M., & Schiavina, M. Applying the Degree of Urbanisation to the globe: A new harmonised definition reveals a different picture of global urbanisation. Journal of Urban Economics, 125, 103312. https://doi.org/10.1016/j.jue.2020.103312
Blogposts
- Introducing the ohsome quality analyst (OQT)
- Behind the scenes of the ohsome quality analyst (OQT)
- The ohsome quality analyst goes public on Github with new release 0.3.0
- ohsome general idea
- ohsomegeneral architecture
- how to become ohsome blog series
- Workshop about ohsome framework at Foss4G 2019
Publications
- Raifer, Martin; Troilo, Rafael; Kowatsch, Fabian; Auer, Michael; Loos, Lukas; Marx, Sabrina; Przybill, Katharina; Fendrich, Sascha; Mocnik, Franz-Benjamin; Zipf, Alexander (2019): OSHDB: a framework for spatio-temporal analysis of OpenStreetMap history data. Open Geospatial Data, Software and Standards.
- Herfort, B., Lautenbach, S., Porto de Albuquerque, J., Anderson, J., Zipf, A.The evolution of humanitarian mapping within the OpenStreetMap community. Scientific Reports 11, 3037 (2021). DOI: 10.1038/s41598-021-82404-z https://www.nature.com/articles/s41598-021-82404-z
- Schott, M.; Grinberger, A. Y.; Lautenbach, S. & Zipf, A. (2021) The Impact of Community Happenings in OpenStreetMap – Establishing a Framework for Online Community Member Activity Analyses In: ISPRS Int. J. Geo-Inf. 10, no. 3: 164. https://doi.org/10.3390/ijgi10030164
- Grinberger, AY, Schott, M, Raifer, M, Zipf, A. (2021): An analysis of the spatial and temporal distribution of large‐scale data production events in OpenStreetMap. Transactions in GIS. 2021; 00: 1– 20. https://doi.org/10.1111/tgis.12746