
Tag: ohsome
-
Mapping Progress in Real Time: Highlights from GeoNight 2024 Mapathon with HeiGIT and Mannheimer Mapathons
During GeoNight 2024, HeiGIT partnered with Mannheimer Mapathons to host a mapathon together. Mapathons are events where volunteers come together to map crucial features like roads, buildings or waterways on OpenStreetMap, often in response to specific needs or crises, such as post-earthquake or post-flood scenarios. We were privileged to connect with volunteers from OSM Ghana, gaining insight into…
-

HeiGIT at FOSSGIS 2024
We’re proud to share our recent conference experience with you! Our HeiGIT Product Owners for Big Data and Smart Mobility, Benjamin Herfort and Julian Psotta, had the privilege of attending the FOSSGIS 2024 conference, where they contributed valuable insights and expertise. The results of an exciting six years of joint work and shared projects between HeiGIT and the Federal Agency for Cartography…
-
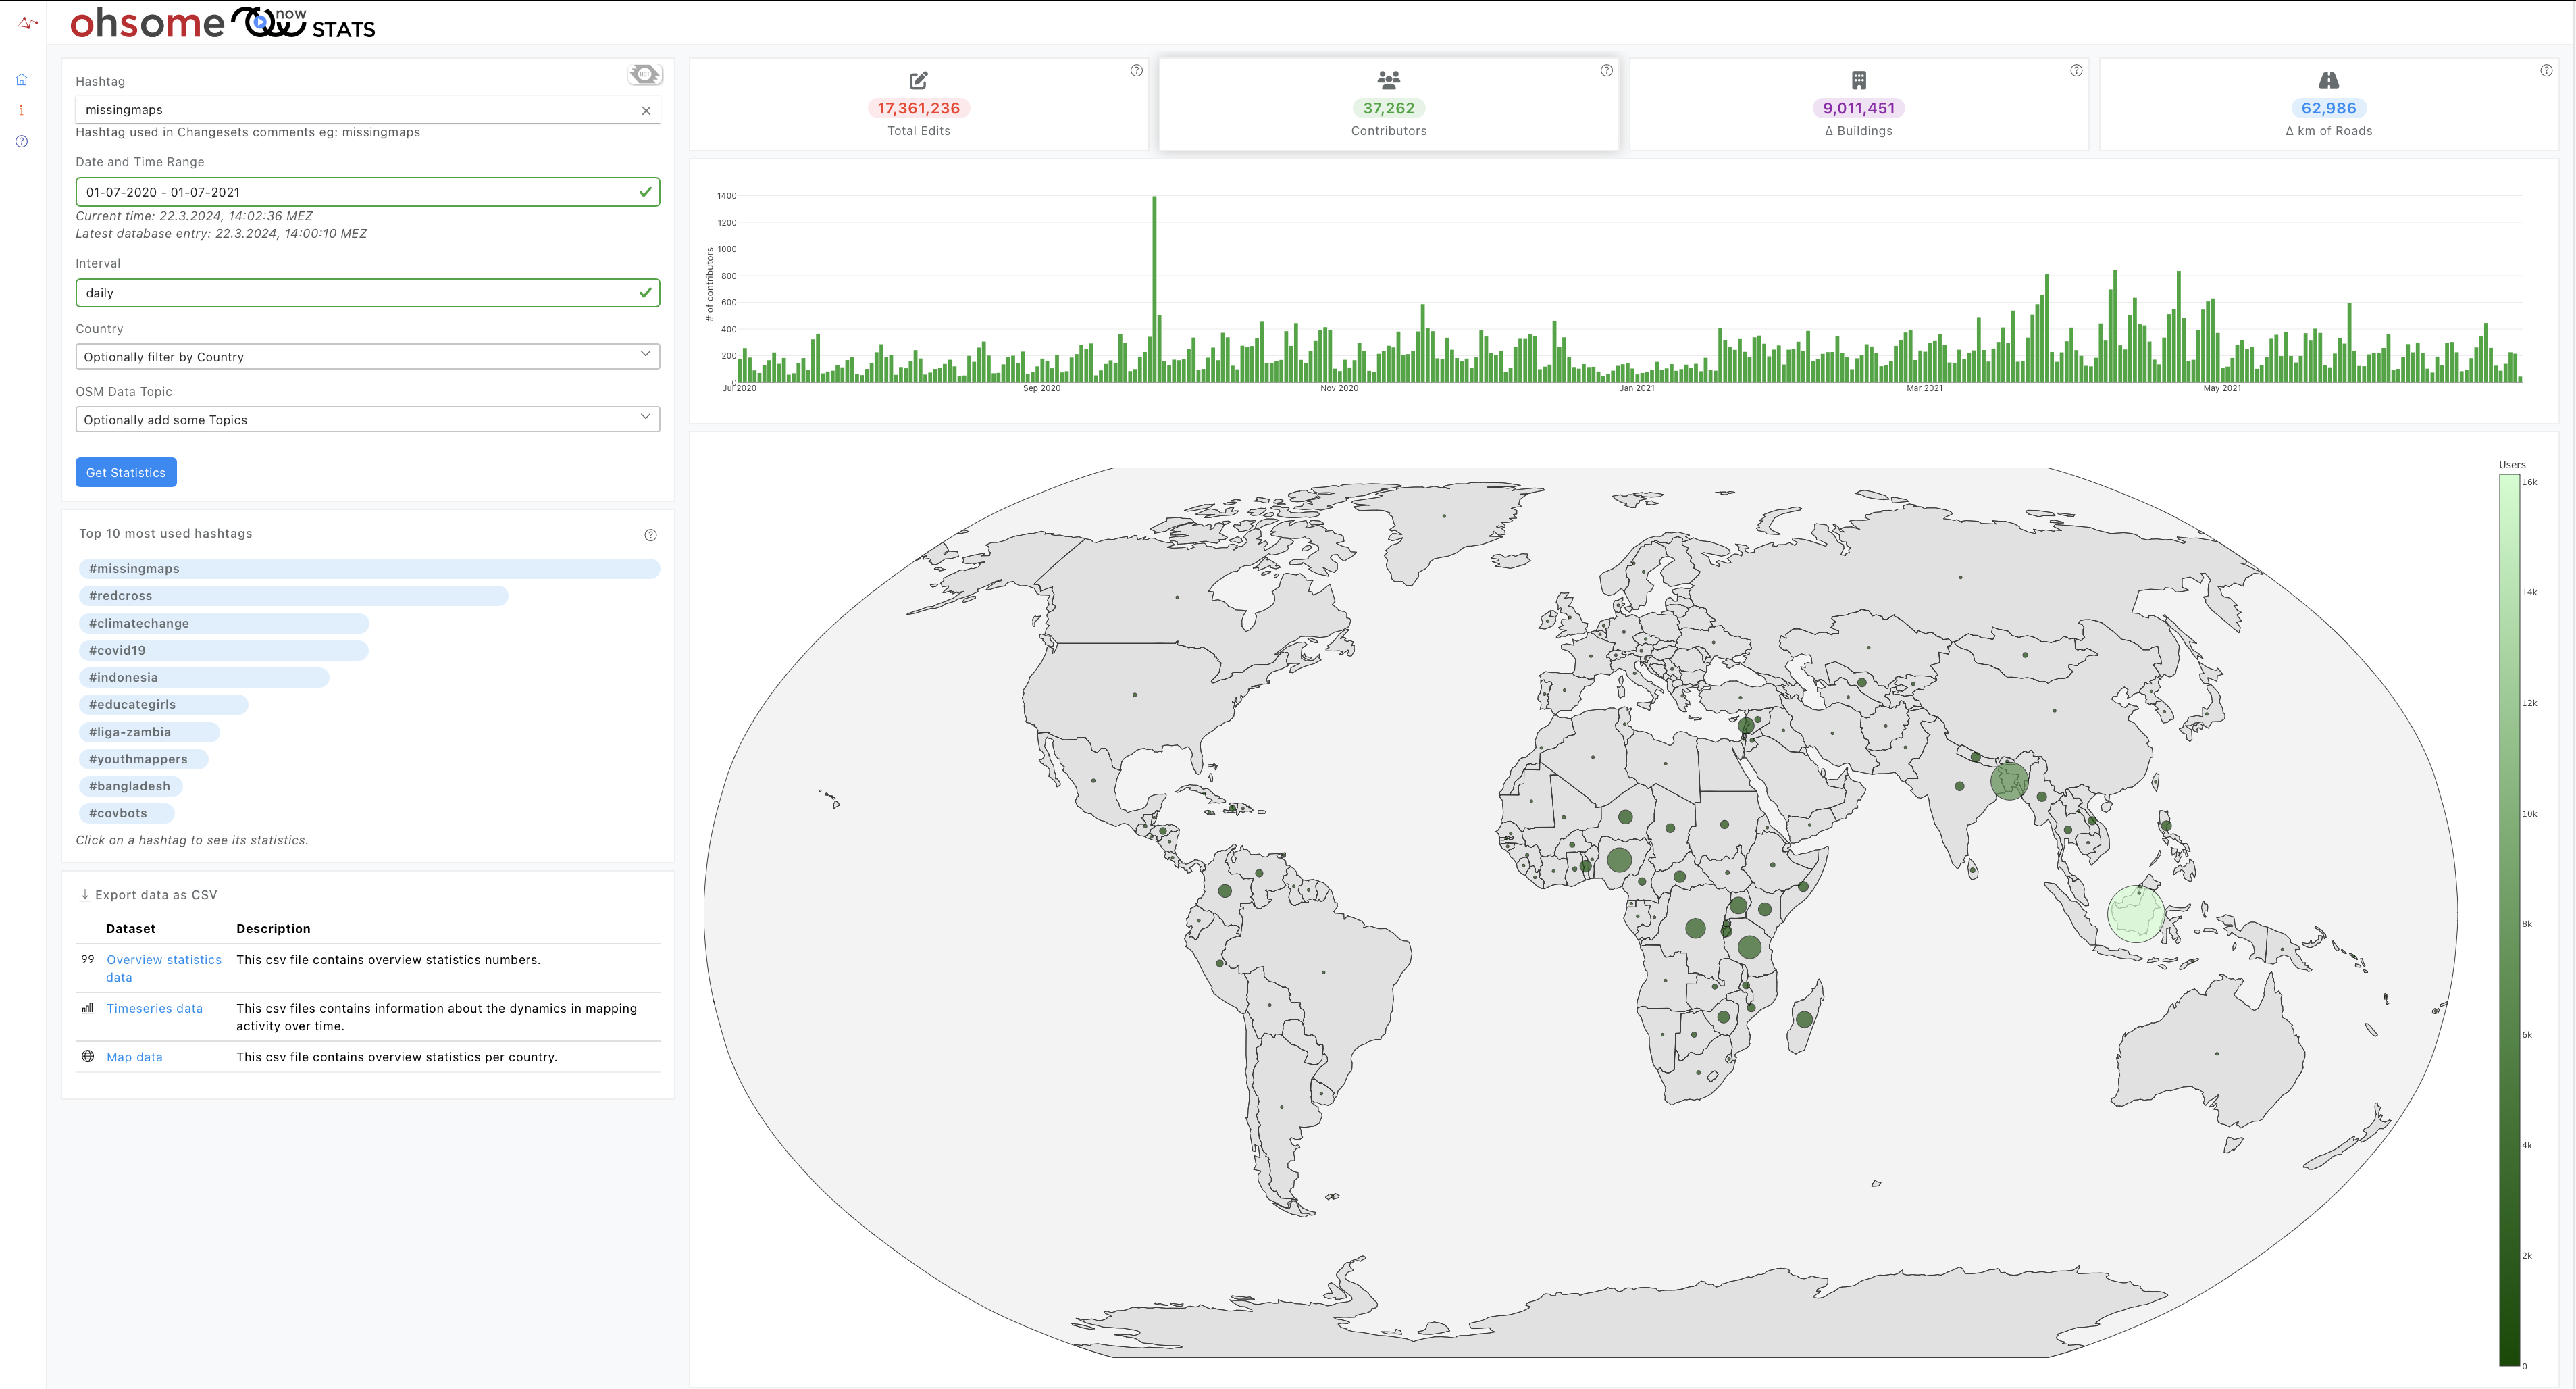
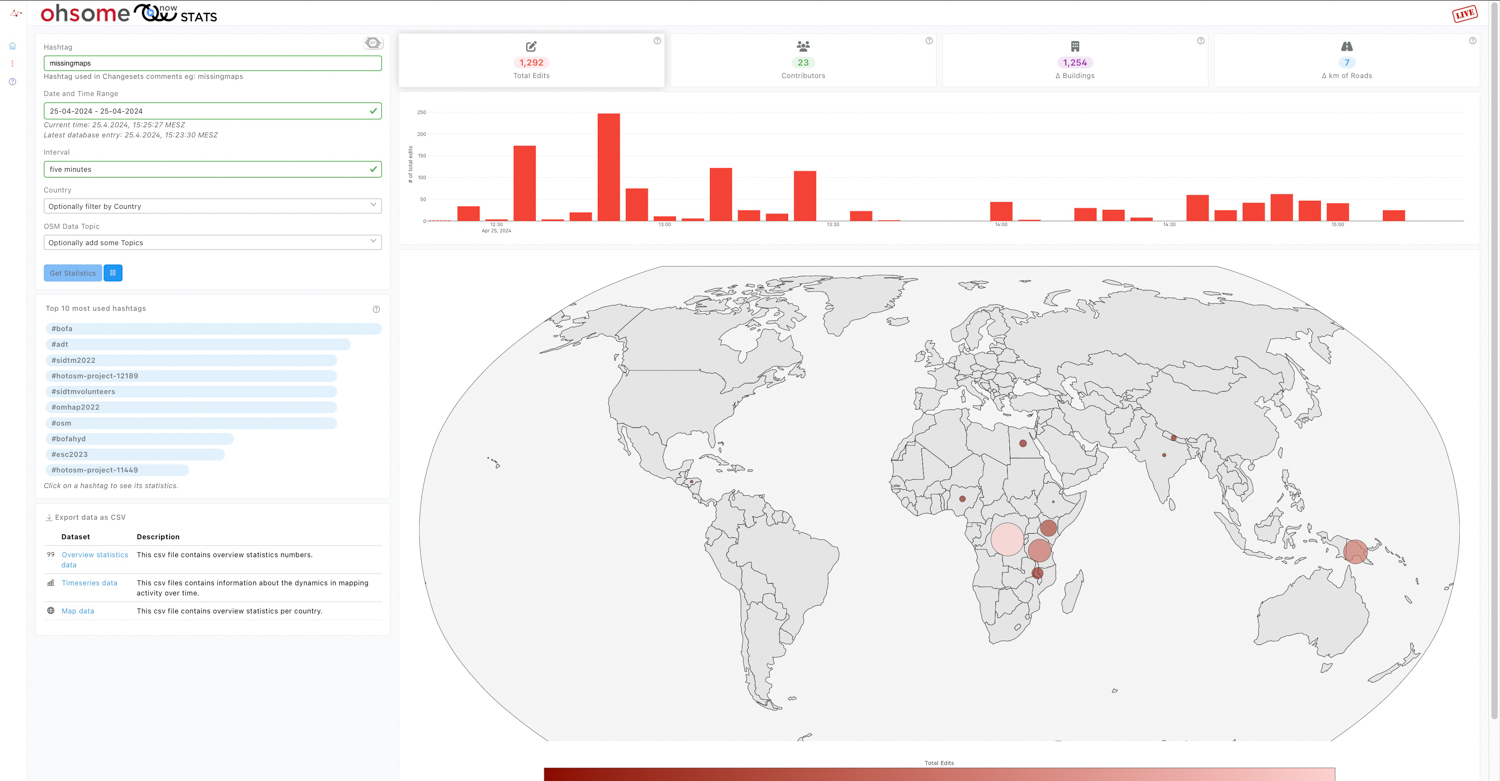
Introducing ohsomeNow stats v1.0
OhsomeNow stats makes it possible to monitor contributions to OpenStreetMap (OSM) in real time. We developed this new dashboard as part of our long-term cooperation with the Humanitarian OpenStreetMap Team (HOT), an international organization dedicated to humanitarian action and community development through open mapping. This dashboard has replaced the Missing Maps Leaderboard with a comprehensive overview…
-
GeoAI4Water 2 Applies Deep Learning to Detect Critical Infrastructure for Disaster Planning
Context During natural disasters and other catastrophic events, quickly identifying and distributing resources is essential. Even a brief delay in evacuating residents or sourcing water can significantly hamper relief efforts and prevent effective disaster management. The HeiGIT and GIScience teams have been actively designing tools to assist in disaster preparation and response, from working with partners to build community resilience to activating our disaster…
-
GeoPrompt – Revolutionizing Navigation and Beyond: HeiGIT’s Innovative Web Application Powered by ChatGPT
Introduction In an era where technology continuously reshapes our world, the fusion of artificial intelligence and geospatial data offers exciting possibilities. HeiGIT (Heidelberg Institute for Geoinformation Technology), a pioneering research organization, has unveiled a novel web application that not only simplifies navigation but also empowers users to access a wealth of location-based data. This proof-of-concept…
-
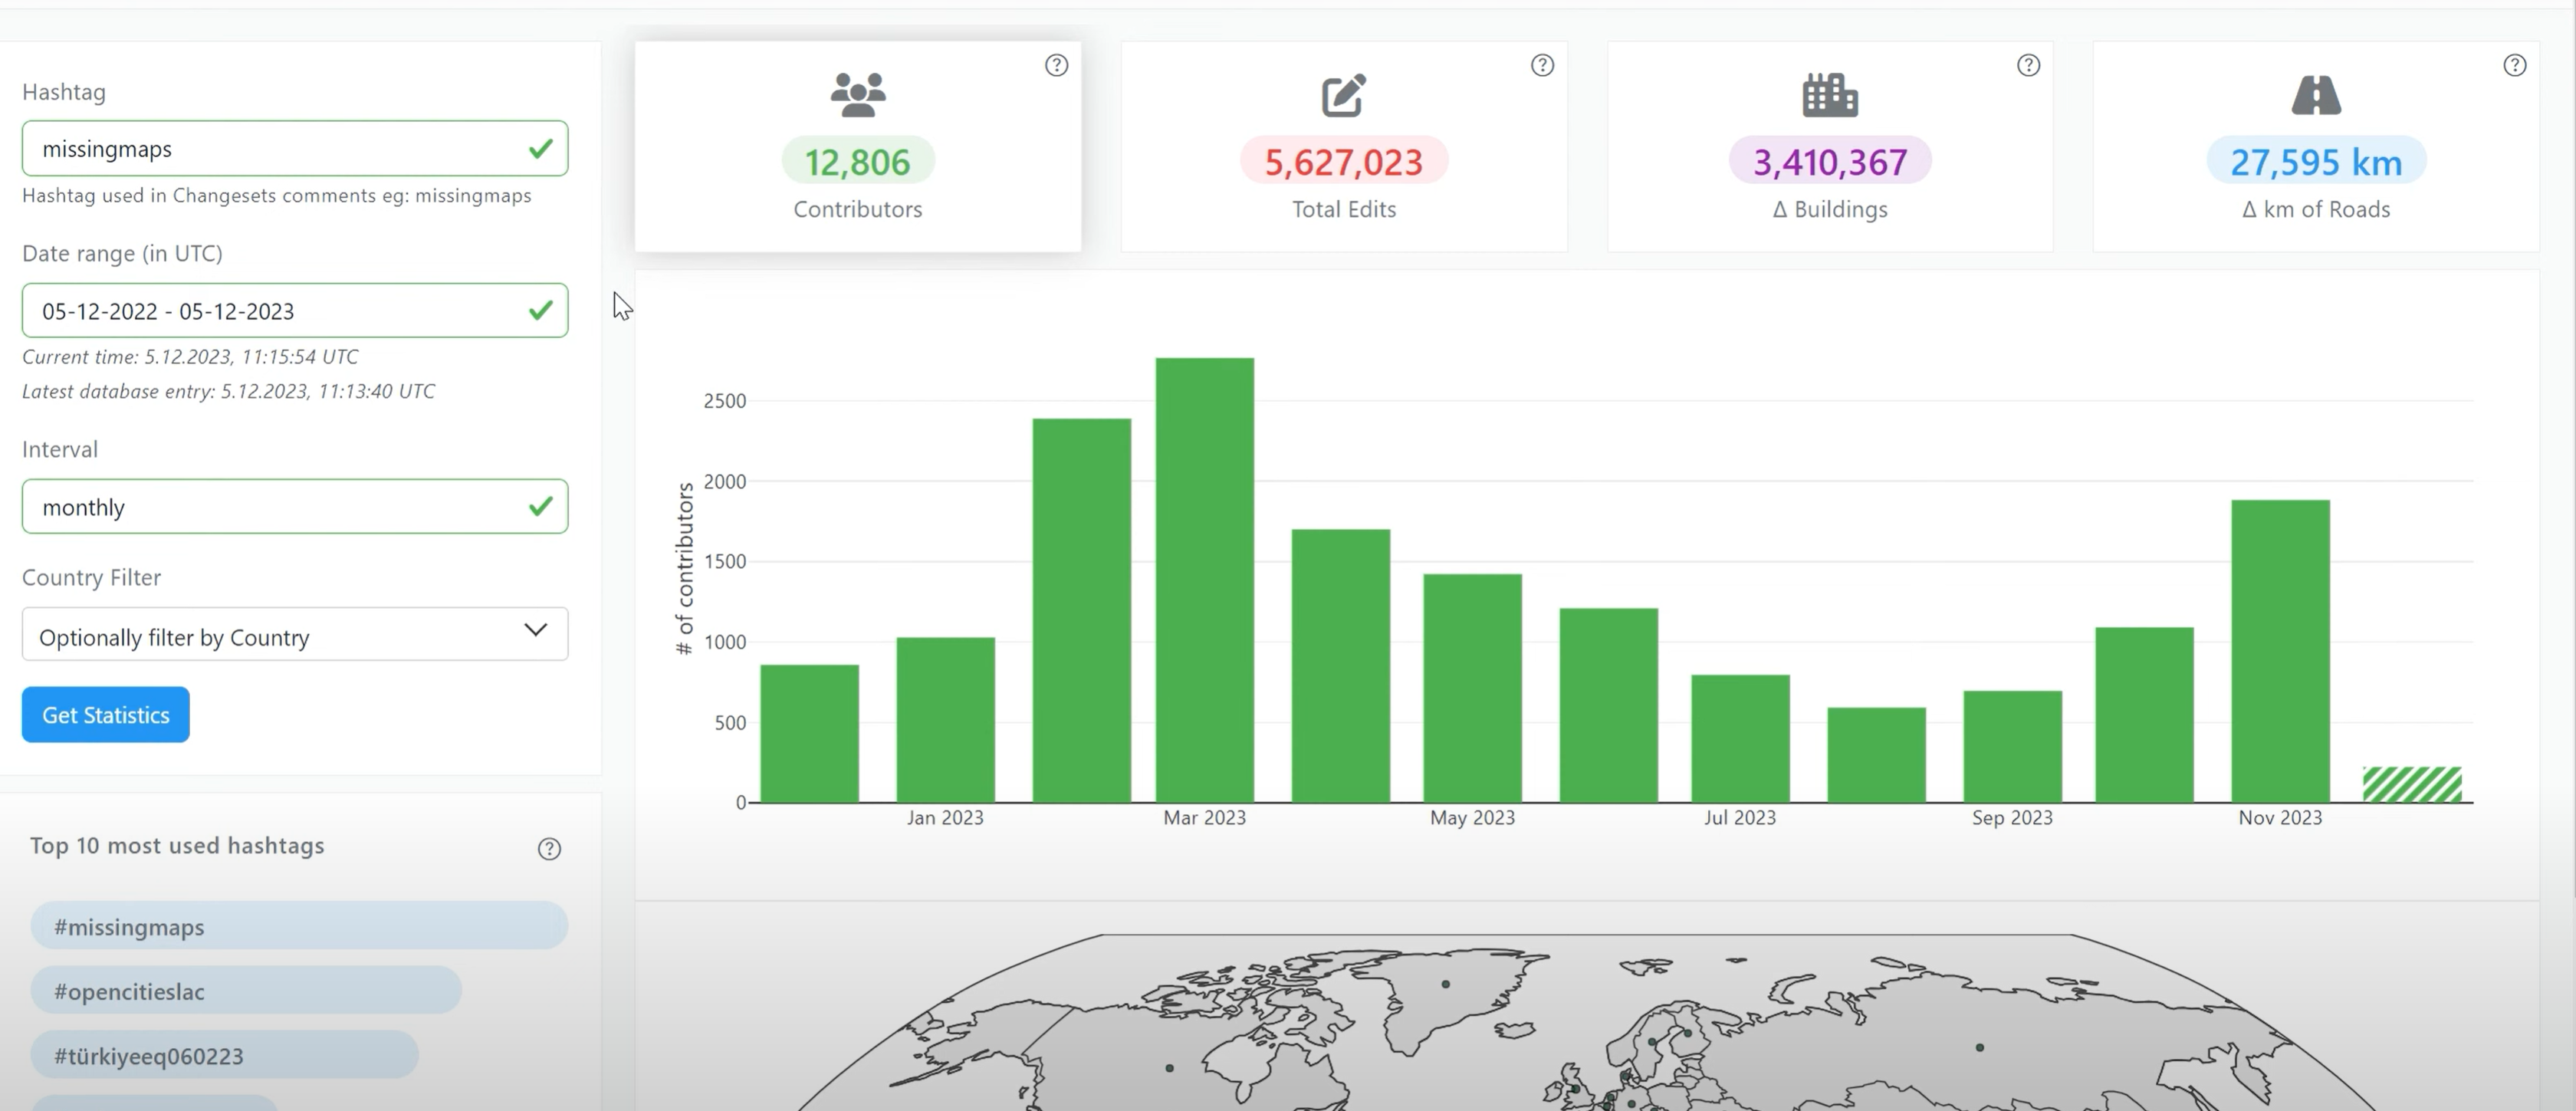
Introducing OhsomeNowStats
OhsomeNowStats allows users to take a look at the mapping activity in OpenStreetMap. This is especially useful for humanitarian organizations and mapathon organizers, because OhsomeNowStats data is updated every 5-10 minutes. Using this tool, user-engagement can be tracked in near real time and used to motivate participants and volunteers alike! By selecting a time range,…
-
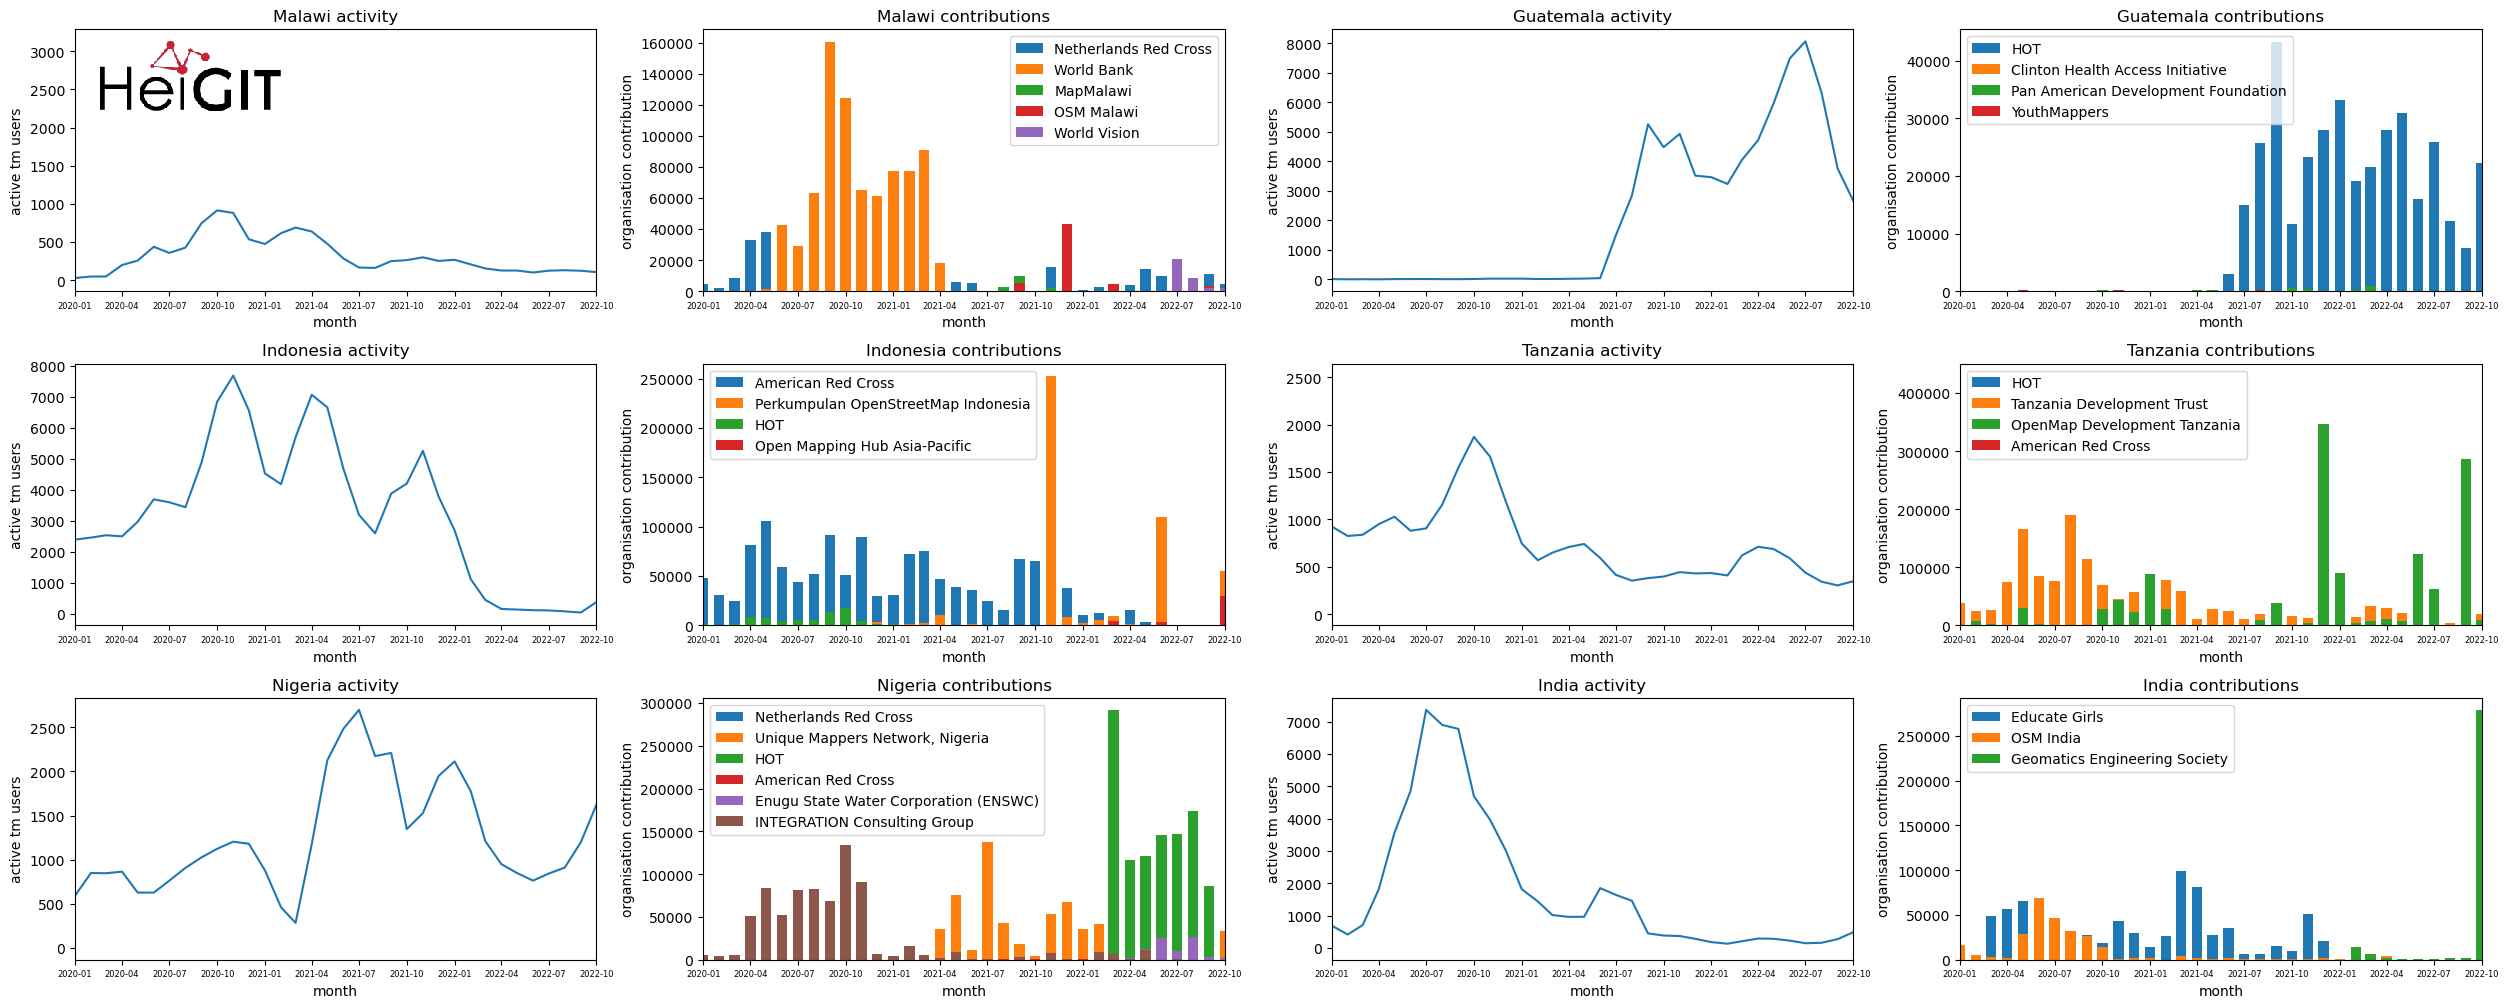
Analysis of Humanitarian OSM Stats: User activity through HOT-TM and contributing organizations
Introduction In this blogpost we are taking a look at humanitarian mapping through the Tasking Manager (HOT-TM) that is operated by the Humanitarian OpenStreetMap Team (HOT). At HeiGIT we work together with HOT to provide analyses and statistics to further understand mapping activity. Explore the user and mapping stats of all Tasking Manager activites here. Check our blog posts about topics…
-
Exploring the Value of Microsoft ML Roads for OSM Data Quality Analysis
The completeness of the OpenStreetMap (OSM) road network has been an ongoing focus for researchers for more than 15 years. For instance, Neis et al. (2011) investigated the OSM street network evolution in Germany and compared it against road data from TomTom. Whereas obtaining reference data has been rather difficult in the past, nowadays we…
-
Version 1.0 of the ohsome quality API and ohsome dashboard
At HeiGIT and in particular within the ohsome team, we strive to provide valuable insights into OpenStreetMap (OSM) data. The ohsome API offers aggregated statistics on the evolution of OSM elements since 2020. These are made easily accessible by the ohsome dashboard. With the ohsome quality API, previously called ohsome quality analyst (OQT), we continue…
-
Taginfo goes ohsome
Did you know that the OpenStreetMap (OSM) taginfo site now lets you access the ohsome dashboard? This allows you to gain refined insights into the usage stats of specific keys and tags. Taginfo is the main source for statistics about keys, tags and current tag usage. In most cases, you have to acces a localized…
-
Visualizing OQT API Results in QGIS
Using the ohsome dashboard, it is possible to explore quality estimation for OpenStreetMap (OSM) data from the ohsome quality analyst (OQT) for arbitrary regions. Also, OQT does provide an API to programmatically fetch quality estimation for a lot of different regions in one request. Chances are that one wants to visualize the results on a…
-

Introducing ohsomeNow stats: Real-Time Monitoring for OpenStreetMap Contributions
You can now monitor contributions to OpenStreetMap (OSM) in real time with ohsomeNow stats! We developed this new dashboard as part of our long-term cooperation with the Humanitarian OpenStreetMap Team (HOT), an international organization dedicated to humanitarian action and community development through open mapping. This dashboard replaces the Missing Maps Leaderboard with a comprehensive overview of…