
A new map in ohsomeHeX provides an overview of areas in Sub-Sahara Africa where information on health facilities is still missing in OpenStreetMap (OSM).
The completeness of OSM is measured by comparing to a reference dataset on public health facilities in Sub-Sahara Africa, which was developed by Maina et al. 2019.
Especially in these days, where the global pandemic outbreak of COVID-19 strikes hard the most vulnerable groups in every country of the world, it is of utmost importance for health planners to get access to health facility data in order to estimate the needs to protect the population.
The ohsomeHeX tool developed by HeiGIT gGmbH provides users insights into the temporal development of health related infrastructure and other OSM data topics.
Background
Better decisions through Open Data. In many countries OpenStreetMap (OSM) data has been collected by volunteers to cover a variety of topics. The openness and accessibility of this data makes it a valuable source of information which can be used to provide specialized spatial services to support societal activities and planning decisions. An improved access to health facility data for planners, international organizations and the public can help taking the right decisions faster and thus to save lives.
Humanitarian and medical operations need data. Many international, national and local governmental and non-governmental organizations need information for planning and implementation of their health programs to improve the provision of health care services to the population, especially in developing regions with a growing population, that is exposed to environmental changes, disaster risks, conflicts or disease outbreaks, like COVID-19. OSM as a free and border-less mapping infrastructure and database has a high potential to be of use as a common platform to collect and provide these data for the benefit of all.
Heterogeneous coverage. In the past 15 years, since the beginning of OSM, the data that volunteers produced has not been collected evenly over the globe. As of today, most data is concentrated in western countries, especially Europe. Thus, large areas are still underrepresented in OSM and a first step is to reveal: Where is the data missing? Where to start mapping and concentrate efforts?
Partnership with healthsites.io. The Global Healthsites Mapping Project (healthsites.io) is a project that aims to facilitate the collection and use of global health facility data and uses OSM as spatial data infrastructure. healthsites.io and HeiGIT are collaborating to better understand the quality and support the sharing and use of OSM health facility data.(-> Healthsites and HeiGIT establish partnership)
The Map
There is a well known need for easy to understand quality measure maps and figures to convince decision makers to help improving OSM by opening their health related data and to motivate volunteers to start mapping in the areas where help is most needed. This map is a first attempt to visualize the areas where OSM is missing data in order to drive attention to the right places and start improving it. Data contributions to improve the situation can be made directly via the website of healthsites.io.
Data & Methods
The map was created based on the comparison of two datasets by calculating the difference between OSM and a reference dataset. The reference dataset is a specific source of public health facilities in Sub-Sahara Africa published by Maina et al. 2019 and available on springernature.figshare and WHO. On the one side we used OSM data -whose completeness was to be evaluated- and filtered them by specific healthcare related tags. On the other side we used the complete unfiltered public health facility reference dataset. Both datasets are not homogeneous and were taken as they are!
The list of OSM tags that have been used in the comparison is based on the list that the healthsites.io project defined on their OSM-WIKI page as of March 2020:
- “amenity=doctors”
- “amenity=pharmacy”
- “amenity=dentist”
- “amenity=hospital”
- “amenity=clinic”
- “healthcare=doctor”
- “healthcare=pharmacy”
- “healthcare=hospital”
- “healthcare=clinic”
- “healthcare=dentist”
- “healthcare=physiotherapist”
- “healthcare=alternative”
- “healthcare=laboratory”
- “healthcare=optometrist”
- “healthcare=rehabilitation”
- “healthcare=blooddonation“
- “healthcare=birthingcenter“
In order to get an insight at the development of the completeness over time we compared different OSM snapshots in a monthly resolution starting from Nov. 2007 to Jan. 2020. To retrieve this type of historic OSM data snapshots we used the technology of HeiGIT’s OpenStreetMap History Database OSHDB (Raifer et al 2019). If you are interested in learning more about the ohsome platform built on top of the OSHDB , you might want to have a look into the ohsome-examples blogpost-series introducing the usage of the ohsome API http://api.ohsome.org/ with several applications and code examples.
Both datasets have been further post-processed in a PostgreSQL/PostGIS database to count the health facilities into several resolutions of a hexagonal grids (ISEA3H) and then subtract the cell values of OSM and the reference dataset for each cell in each resolution and each time-snapshot.
Results & Future plans
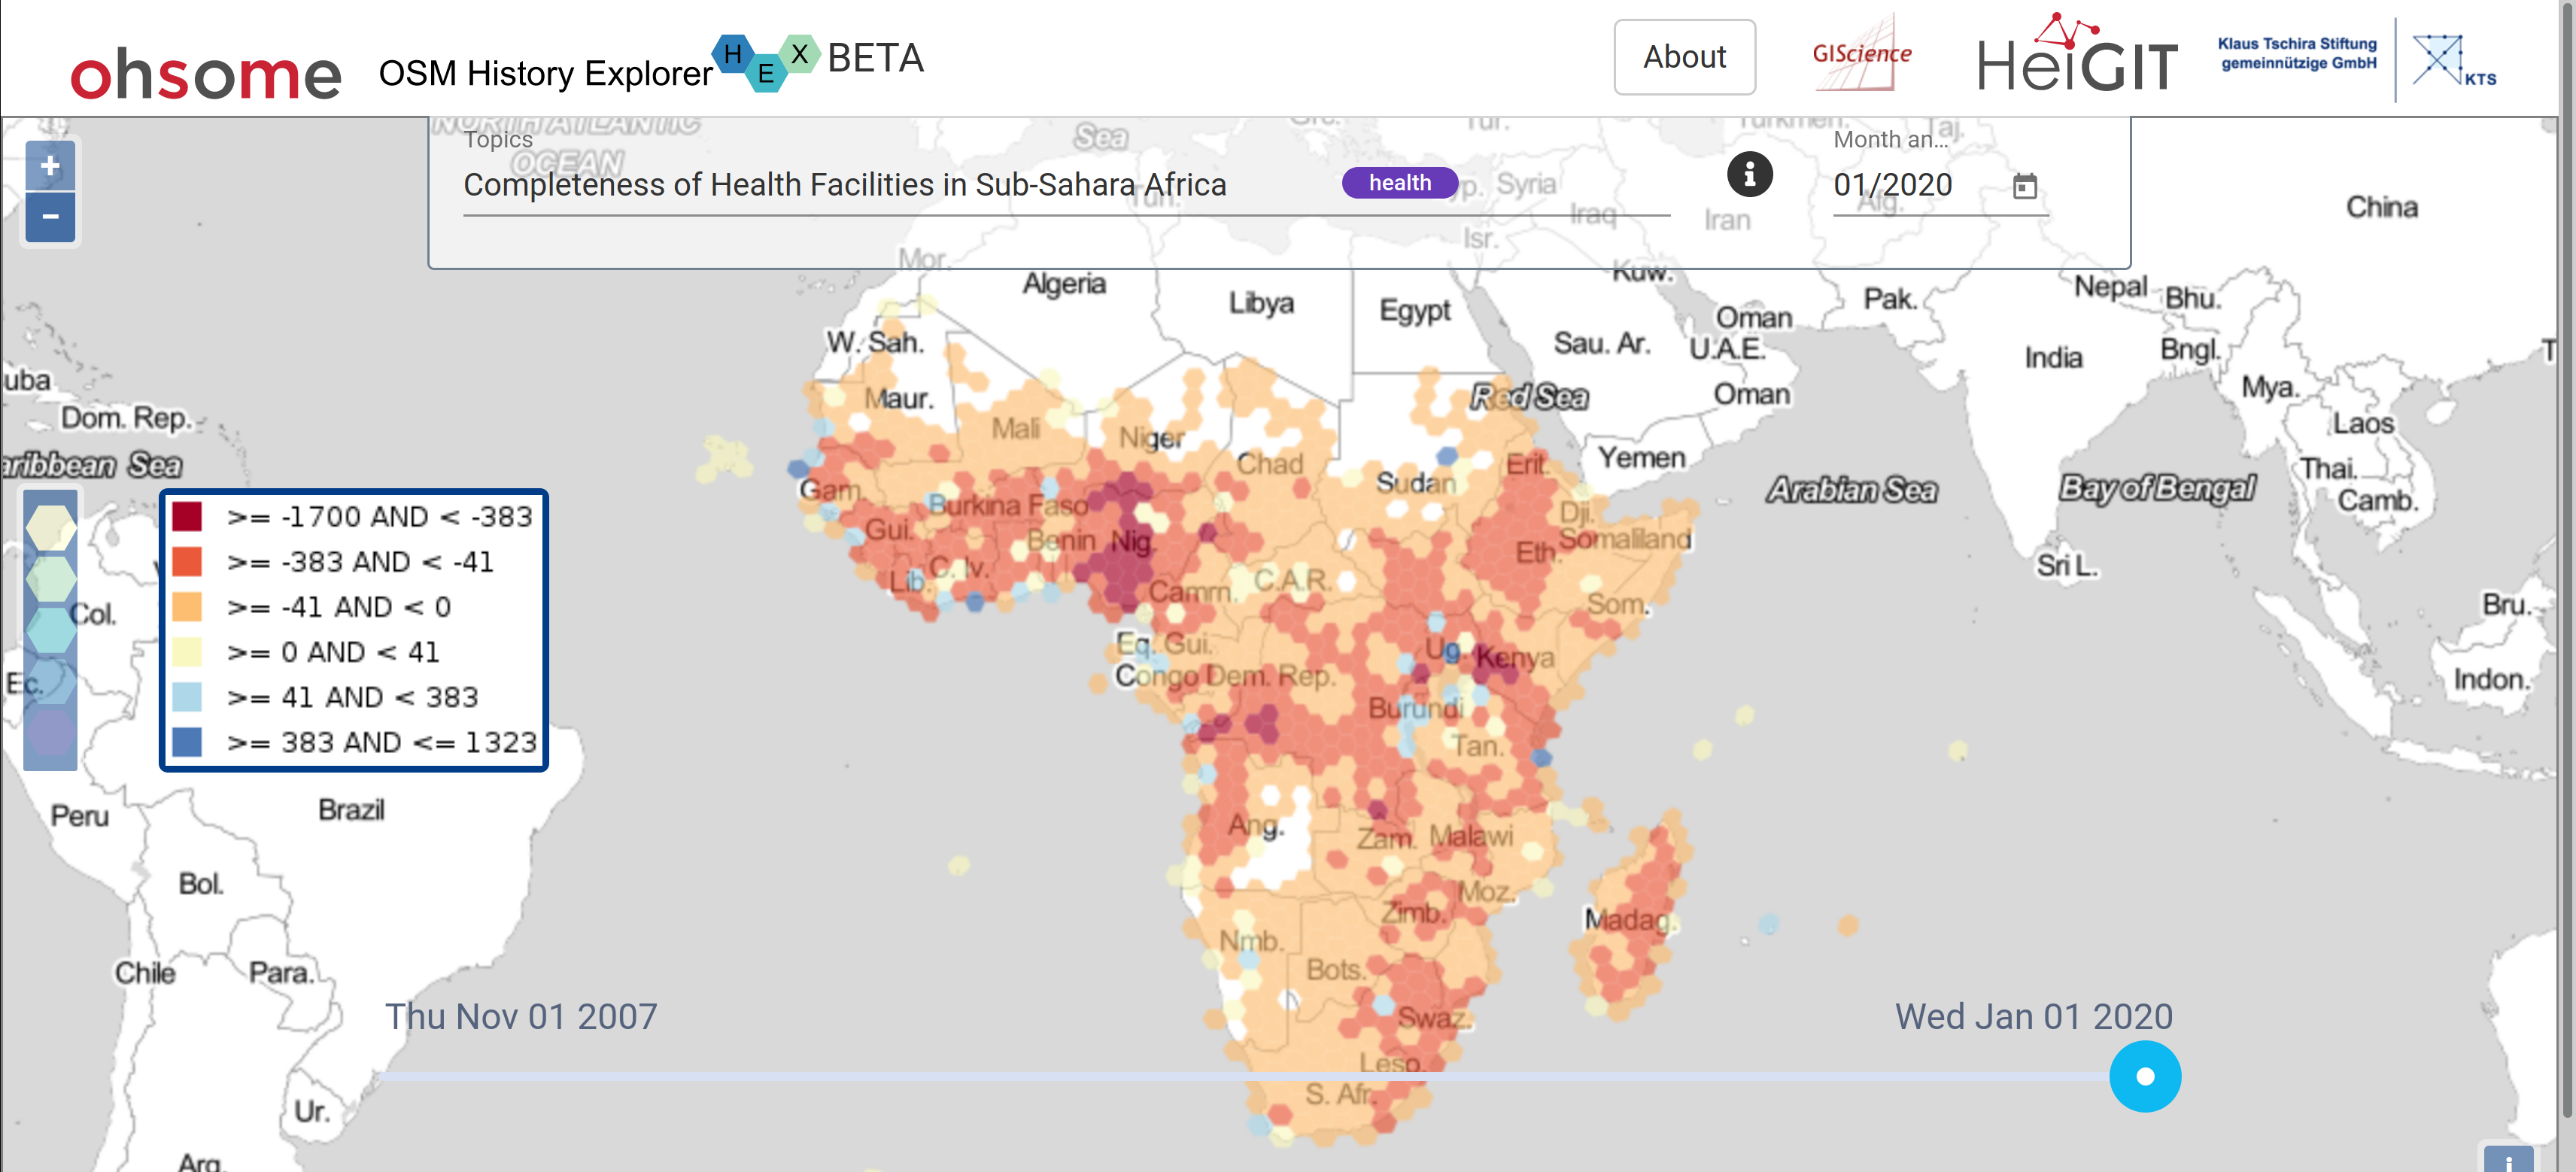
The results can be interactively explored in ohsomeHeX. The map shows the potential completeness of OSM health facilities in Sub-Sahara Africa. Red-ish color indicate missing facilities to be mapped, blue-ish colors represent areas with more health facilities than in the reference dataset.
The results vary between countries but also between rural areas and cities. The used method result in values that do not precisely represent the real situation, but can be understood as a rough “big picture” to identify potential areas to be completed in OSM.
Further refinements of this analysis in the sense of comparing specific subsets of both datasets, e.g. hospitals only or clinics, or pharmacies etc. seem to have the potential to give a more precise picture of the OSM completeness and are planned for the future.
Many activities by humanitarian organizations and governments related to COVID-19 are currently focused on improving healthsites data. Therefore it is important to do research on data completeness to give hints where to concentrate efforts and to monitor the progress of the activities. For Africa there is still a long way to go to be able to provide the necessary health services and capacities. Everybody can help to improve the situation, now!
To help improving the map with respect to health facilities please consider using the platform of healthsites.io or directly contribute to OSM !
Related Links
- healthsites.io
- OSM-WIKI: The Global Healthsites Mapping Project
- Reference Data: springernature.figshare
- Article on reference data: Maina, J., Ouma, P.O., Macharia, P.M. et al. A spatial database of health facilities managed by the public health sector in sub Saharan Africa. Sci Data 6, 134 (2019). https://doi.org/10.1038/s41597-019-0142-2
- Blog: OSHDB: a framework for spatio-temporal analysis of OpenStreetMap history data
- Blog: Exploring OSM history: the example of health related amenities
Raifer, M, Troilo, R, Kowatsch, F, Auer, M, Loos, L, Marx, S, Przybill, K, Fendrich, S, Mocnik, FB & Zipf, A (2019): OSHDB: a framework for spatio-temporal analysis of OpenStreetMap history data. Open Geospatial Data, Software and Standards, https://doi.org/10.1186/s40965-019-0061-3.
Earlier work on using the platform, e.g.:
Auer, M.; Eckle, M.; Fendrich, S.; Griesbaum, L.; Kowatsch, F.; Marx, S.; Raifer, M.; Schott, M.; Troilo, R.; Zipf, A. (2018): Towards Using the Potential of OpenStreetMap History for Disaster Activation Monitoring. ISCRAM 2018. Rochester. NY. US.