
Welcome back to our Region of the Month series. If you’re hearing about this format the first time you should definitely check out some of our older blog posts, e.g. this one on the tagged forests of different places in Canada or this first part of a street network analysis!
Since it’s May and getting warmer again, we decided to analyze some hiking related tags. Keep reading if you want to find out how we went about in this analysis!
Data:
First things first. As usual, we need some input boundary data for our request to the ohsome API. There are different options like giving coordinates for a boundary box manually or, using an input polygon with all the data, which is what we do here (in this blog post series) most of the time. We got our polygon data here.
Requests:
The next step is to define filter conditions which can be used in a request to the ohsome API.
For a start it would most likely be helpful to look at tags with type:way and figure out which filter conditions would be best to only get actual hiking trails or paths. Unfortunately, as you will soon discover, things are not quite as simple as they may seem first.
In a first step, we wanted to filter some type:way hiking related tags. For this purpose, it should be defined what one would like to count as a “hiking trail“. According the the Cambridge dictionary hiking is “the activity of going for long walks in the countryside“.
For dedicated hiking trails highway=path would be the preferred tag when taking the OpenStreetMap wiki into consideration. For dedicated hiking trails highway=path is be the preferred tag, but according to the OpenStreetMap wikisome further tags are also be used to map hiking related infrastructure.
time=2008-01-01/2022-04-01/P1M
filter=type:way and (highway in (path, track, footway) and not footway in (sidewalk, crossing))
endpoint: /elements/length and /elements/length/density as countries of different sizes were used
Example for a request to the ohsome API:
curl --data-urlencode "bpolys@YourInputBoundary.geojson" \
--data-urlencode "filter=type:way and (highway in (path, track, footway) and not footway in (sidewalk, crossing))" \
--data-urlencode "time=2008-01-01/2022-04-01/P1Y" \
--data-urlencode "format=csv" \
-X POST https://api.ohsome.org/v1/elements/length \
-o YourOutputFile.csv
Data Exploration:
The first part of the analysis was on the increase in absolute values. For that, requests with the endpoint /elements/length were sent to the ohsome API.
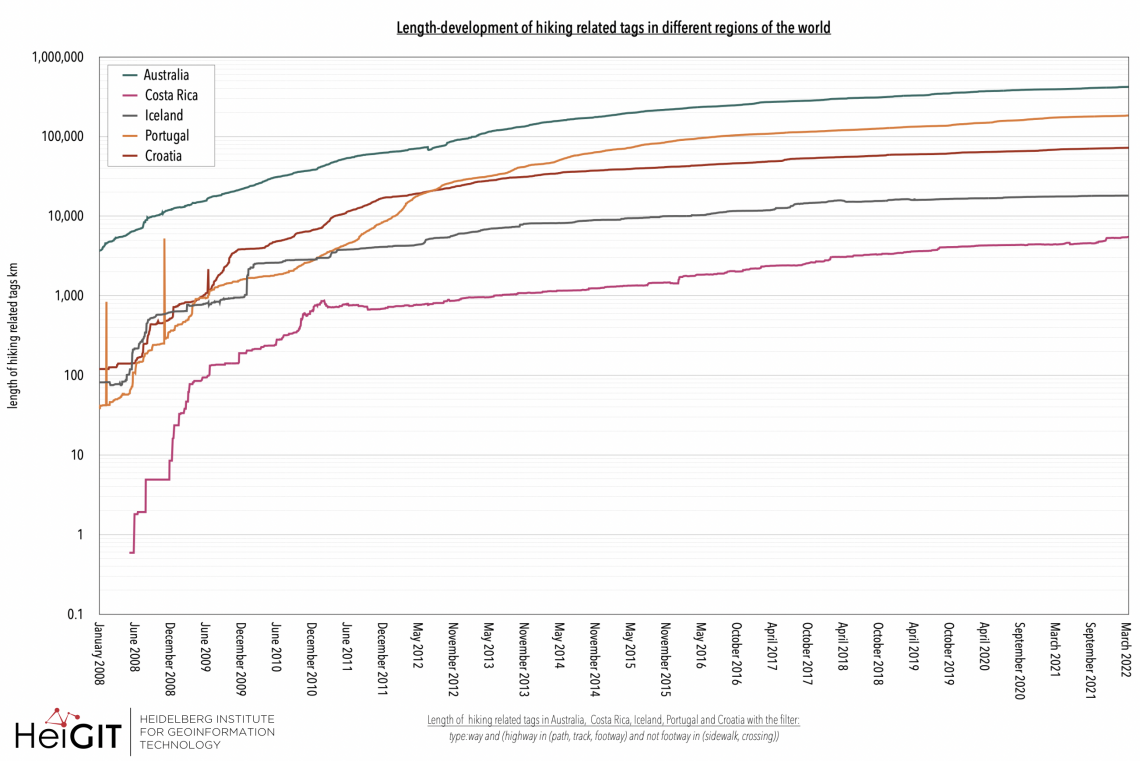
In this first figure, the development of all countries considered is shown, and, as to be expected one can see a general increase for all regions. Another rather obvious circumstance displayed in the figure is the fact, that the absolute values of Australia are the highest. This is most likely because it is by far the largest country considered. Costa Rica displays quite low absolute values of hiking related tags which should be at least in parts related to it being the smallest country. Croatia, Portugal and Australia show a pretty steady growth whilst Iceland and Costa Rica display a less intense gradient.
Because of their difference in size, especially when it comes to Australia, comparing the countries’ values proves rather difficult, which is why another set of requests were sent in order to get a relative value. For this, the endpoint /elements/length/density was used.
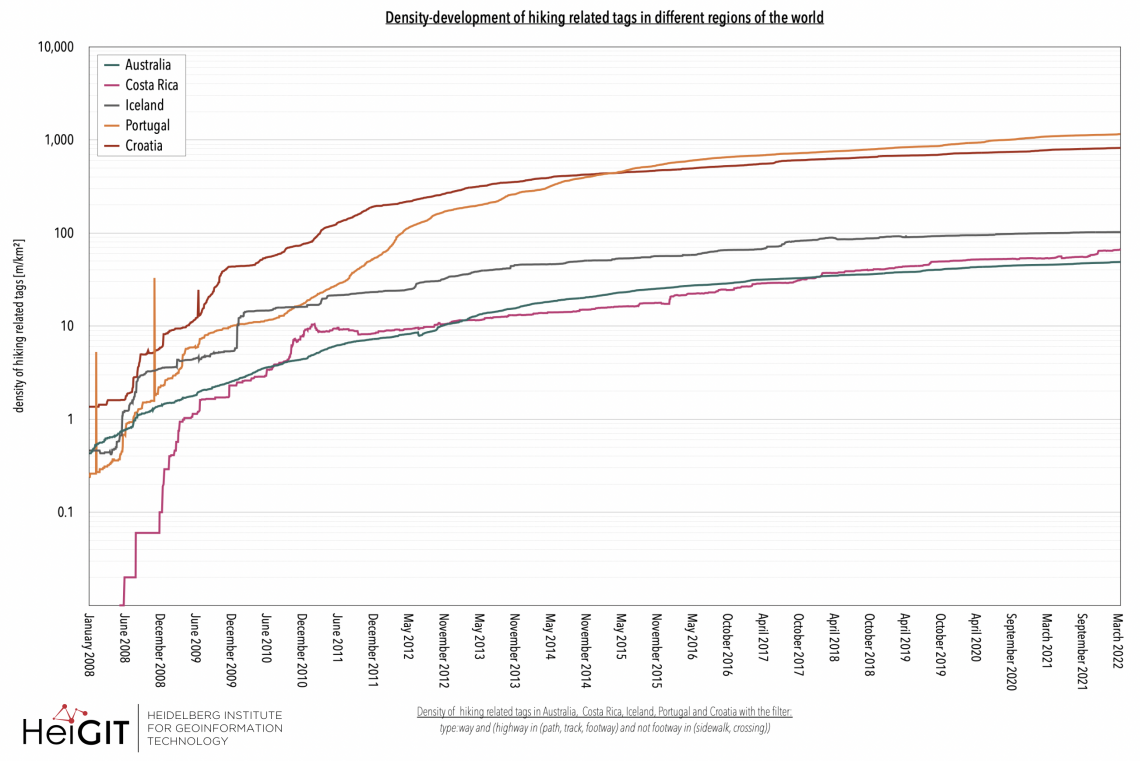
As we now have values which are in relation to each region’s size, we can go on and compare the developments easier. One thing that sticks out are the values of Australia, which, due to its size, had the highest absolute values but now happens to be the one with the smallest values. Portugal and Croatia however, are at the top now. Although Croatia displayed the highest values until 2015, Portugal surpassed it and has since been number one. Iceland and Costa Rica display quite low values in this case too, so besides the country size there might be other reasons (different tagging conventions, not as active mapping community, not as many dedicated trails …) that contribute to the given values. Still, both managed to surpass Australia!
Portugal and Croatia both have dedicated pages (Portugal, Croatia) on hiking in the OSMwiki, which might be an indicator that related tags inherit a form of significance within the mapping of these regions, as the documentation is quite good, especially in the case of Portugal.
There seems to be no such thing for Iceland, however, its map feature-page links directly to the general map feature-page whilst giving insight on certain local tagging conventions. Australia appears to have particular conventions/definitions for the tags path and track given, too. Costa Rica does apparently not have a dedicated hiking-page, BUT the information that many tracks (in terms of roads) are unclassified.
To have another relative value with which we could compare the development of the countries, the percentage change of absolute length in km was calculated. For this, we took the absolute values of 2021-04-01 and 2022-04-01 and compared them.
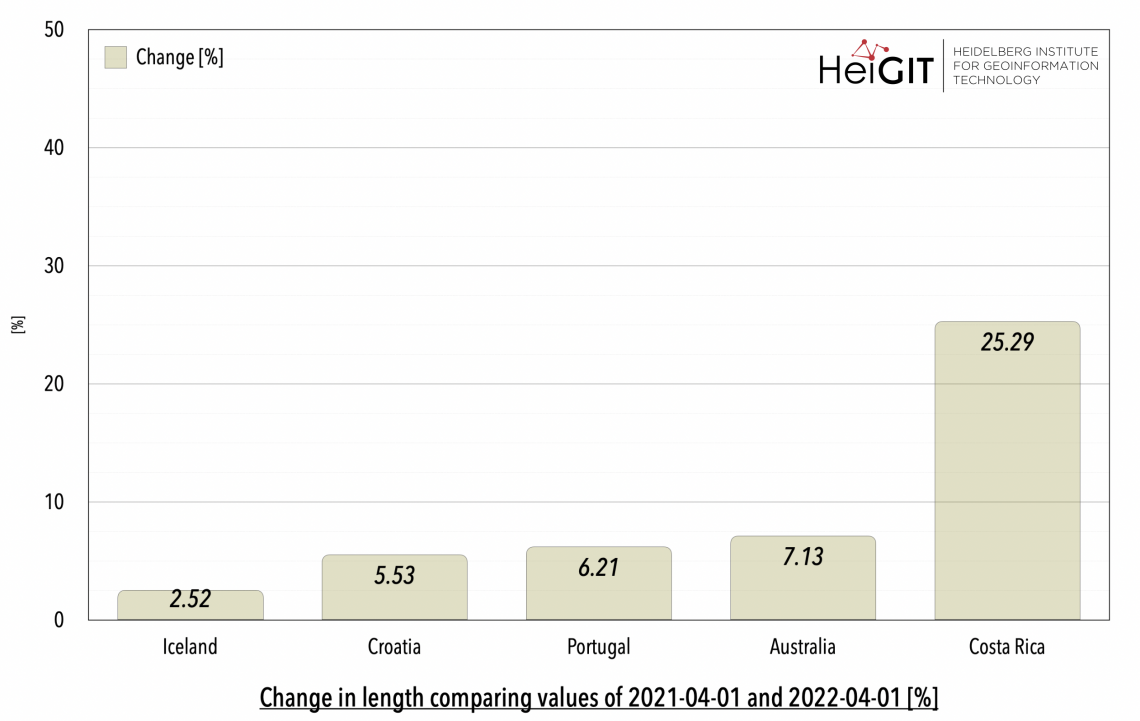
Looking at the development of the last year can help examining the activity and estimating completeness of highway related tags in the different countries with communities which have existed for some time.
Iceland shows a rather low percentual change which could indicate that there are not many more hiking related opportunities in Iceland, or tagging them simply might not be a priority. Together with Croatia, Portugal and Australia the change values are below 10%. Croatia and Portugal, which have generally high values in comparison only display small changes. Alongside with Australia there are still small (but notable) changes. The highest percentage change can be seen in Costa Rica. It has the strongest individual development at the moment whilst also being the country with a later start date of hiking related tags being mapped.
Due to its sheer size, Australia is definitely the Region of the Month with respect to absolute length development. However, when it comes to relative development of all countries with help of the density-values Portugal and Croatia win the title. Last but not least, Costa Rica clearly should get some credit for the enormous individual increase throughout the last year!
Thank you for reading this first part of our analysis on hiking related tracks, we hope you found it helpful. Stay tuned for part two!
Background info: the aim of the ohsome OpenStreetMap History Data Analytics Platform is to make OpenStreetMap’s full-history data more easily accessible for various kinds of OSM data analytics tasks, such as data quality analysis, on a regional, country-wide, or global scale. The ohsome API is one of its components, providing free and easy access to some of the functionalities of the ohsome platform via HTTP requests. Some intro can be found here:
- ohsome general idea
- ohsome general architecture
- how spatial joins queries work in the OpenStreetMap History Database OSHDB
- the whole “how to become ohsome” tutorials series
- GIScience / HeiGIT OpenSource git repositories: github.com/GIScience
Related Literature (usage examples of ohsome.org)
- Raifer, M; Troilo, R; Kowatsch, F; Auer, A; Loos, L; Marx, S; Przybill, K; Fendrich, S; Mocnik, F; Zipf, A. (2019): OSHDB: a framework for spatio-temporal analysis of OpenStreetMap history data. Open Geospatial Data, Software and Standards.
- Brückner, J., Schott, M., Zipf, A., Lautenbach, S. (2021): Assessing shop completeness in OpenStreetMap for two federal states in Germany, AGILE GIScience Series. 2(20): 1-7.
- Witt, R., Loos, L., Zipf, A. (2021): Analysing the Impact of Large Data Imports in OpenStreetMap. ISPRS Int. J. Geo-Inf. 10(8): 528.
- Fritz, O., Auer, M., Zipf, A.( 2021): Entwicklung eines Regressionsmodells für die Vollständigkeitsanalyse des globalen OpenStreetMap-Datenbestands an Nahverkehrs-Busstrecken.” AGIT ‒ Journal Für Angewandte Geoinformatik. 7-2021.
- Schott, M.; Grinberger, A.Y.; Lautenbach, S.; Zipf, A. (2021): The Impact of Community Happenings in OpenStreetMap—Establishing a Framework for Online Community Member Activity Analyses. ISPRS Int. J. Geo-Inf. 2021, 10, 164. https://doi.org/10.3390/ijgi10030164
- Herfort, B., Lautenbach, S., Porto de Albuquerque, J., Anderson, J., Zipf, A. (2021): The evolution of humanitarian mapping within the OpenStreetMap community. Scientific Reports 11, 3037 (2021).
DOI: 10.1038/s41598-021-82404-z - Ludwig, C., Fendrich, S., Zipf, A. (2020): Regional Variations of Context-based Association Rules in OpenStreetMap. Transactions in GIS DOI: 10.1111/tgis.12694
- Auer, M.; Eckle, M.; Fendrich, S.; Griesbaum, L.; Kowatsch, F.; Marx, S.; Raifer, M.; Schott, M.; Troilo, R.; Zipf, A. (2018): Towards Using the Potential of OpenStreetMap History for Disaster Activation Monitoring. ISCRAM 2018. Rochester. NY. US.
- Wu, Z, Li, H, & Zipf, A. (2020). From Historical OpenStreetMap data to customized training samples for geospatial machine learning. In proceedings of the Academic Track at the State of the Map 2020 Online Conference, July 4-5 2020. DOI: http://doi.org/10.5281/zenodo.3923040
- Grinberger, A.Y., Schott, M., Raifer, M., Zipf, A. (2021): An analysis of the spatial and temporal distribution of large‐scale data production events in OpenStreetMap. Transactions in GIS. 00: 1– 20. https://doi.org/10.1111/tgis.12746
- Further publications